.png)
Widgets are organised within the following categories:
-
Asset
-
Asset widgets regard your fleet, i.e. the assets you have been granted visibility of.
-
-
Card*
-
Chart*
-
Defects
-
EBPMS
-
Finance
-
Fuel Efficiency
-
Lighting
-
List*
-
Load
-
Maintenance
-
Site
-
Table*
-
TPMS/Tyres
*category refers to the type of widget
Widgets
|
Widget |
Purpose† |
Type |
Categories |
Example |
|---|---|---|---|---|
|
Asset Total |
The total number of commissioned assets. |
Card |
Asset |
|
|
Assets Coupled |
The total number of coupled assets. |
Card |
Asset |
|
|
Assets Static |
The total number of static (unmoving) assets in your fleet. |
Card |
Asset |
|
|
Assets Good |
The total number of assets with a good overall status. |
Card |
Asset |
|
|
Assets Warning |
The total number of assets with a warning overall status. |
Card |
Asset |
|
|
Assets Critical |
The total number of assets with a critical overall status. |
Card |
Asset |
|
|
Assets Due Inspection |
The total number of assets which are due an inspection soon** |
Card |
Asset, Maintenance |
|
|
Assets Due MOT |
The total number of assets which are due an MOT soon** |
Card |
Asset, Maintenance |
|
|
Assets On Road |
The total number of assets which are ‘On-Road’ i.e. not set to VOR. |
Card |
Asset, Maintenance |

|
|
Assets VOR |
The total number of assets which are VOR. |
Card |
Asset, Maintenance |
|
|
Assets Tracked |
The total number of assets which have a DCU. |
Card |
Asset |
|
|
Assets Untracked |
The total number of assets which do not have a DCU. |
Card |
Asset |
|
|
EBPMS Collecting Data |
The total number of assets which have EBPMS enabled. |
Card |
Asset, EBPMS |
|
|
EBPMS Good |
The total number of assets which have EBPMS enabled and a good EBPMS status. |
Card |
Asset, EBPMS |
|
|
EBPMS Warning |
The total number of assets which have EBPMS enabled and a warning EBPMS status. |
Card |
Asset, EBPMS |
|
|
EBPMS Critical |
The total number of assets which have EBPMS enabled and a critical EBPMS status. |
Card |
Asset, EBPMS |
|
|
Lighting Collecting Data |
The total number of assets which have Lighting enabled. |
Card |
Asset, Lighting |

|
|
Lighting Good |
The total number of assets which have Lighting enabled and a good Light status. |
Card |
Asset, Lighting |
|
|
Lighting Warning |
The total number of assets which have Lighting enabled and a warning Light status. |
Card |
Asset, Lighting |
|
|
Lighting Criticial |
The total number of assets which have Lighting enabled and a critical Light status. |
Card |
Asset, Lighting |
|
|
Load Waiting Unloading |
The total number of assets which have Load enabled and are awaiting unloading. |
Card |
Asset, Load |
|
|
Load Safe |
The total number of assets which have Load enabled and have a safe load. |
Card |
Asset, Load |
|
|
Load Warning |
The total number of assets which have Load enabled and have a warning load. |
Card |
Asset, Load |
|
|
Load Overloaded |
The total number of assets which have Load enabled and are overloaded. |
Card |
Asset, Load |
|
|
Maintenance Good |
The total number of assets which have Maintenance enabled and a good Maintenance status. |
Card |
Asset, Maintenance |
|
|
Maintenance Warning |
The total number of assets which have Maintenance enabled and a warning Maintenance status. |
Card |
Asset, Maintenance |
|
|
Maintenance Critical |
The total number of assets which have Maintenance enabled and a critical Maintenance status. |
Card |
Asset, Maintenance |
|
|
TPMS Collecting Data |
The total number of assets which have TPMS enabled. |
Card |
Asset, TPMS |
|
|
TPMS Good |
The total number of assets which have TPMS enabled and a good TPMS status. |
Card |
Asset, TPMS |
|
|
TPMS Warning |
The total number of assets which have TPMS enabled and a warning TPMS status. |
Card |
Asset, TPMS |
|
|
TPMS Critical |
The total number of assets which have TPMS enabled and a critical TPMS status. |
Card |
Asset, TPMS |
|
|
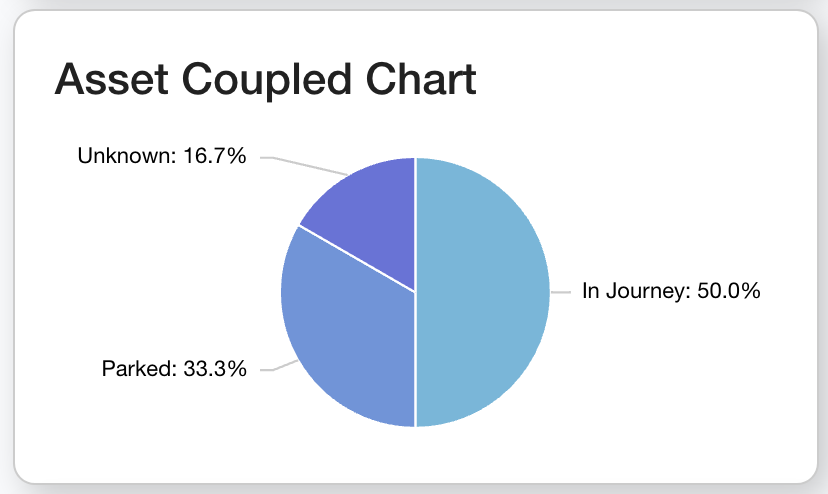
Asset Coupled Chart |
A pie chart showing the total assets In Journey, Parked, or Unknown. |
Pie Chart |
Asset |
|
|
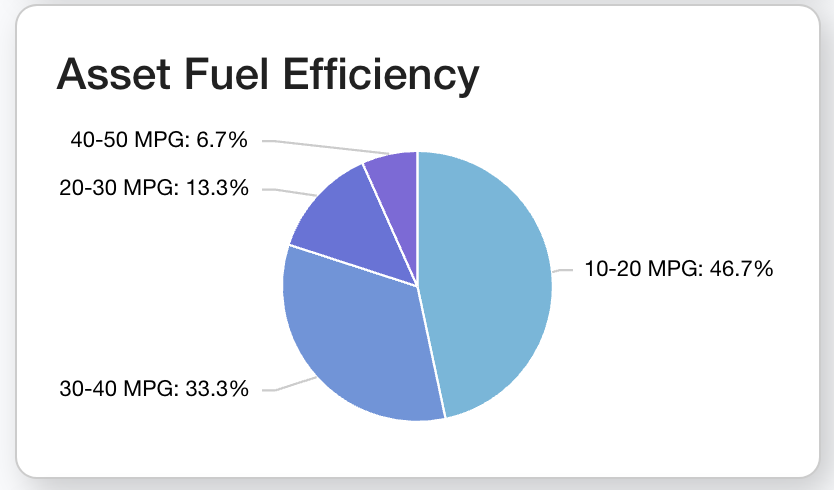
Asset Fuel Efficiency |
A pie chart showing the total assets in different bands of fuel MPG. |
Pie Chart |
Asset, Fuel Efficiency |
|
|
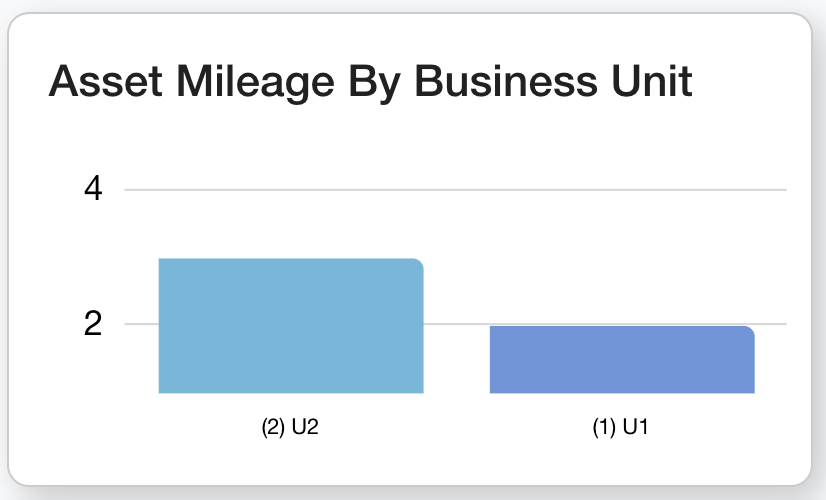
Asset Mileage By Business Unit |
A bar chart to show mileage (odometer readings) by Business Unit. |
Bar Chart |
Asset |
|
|
Asset Milage By Customer |
A bar chart to show mileage (odometer readings) by Customer. |
Bar Chart |
Asset |

|
|
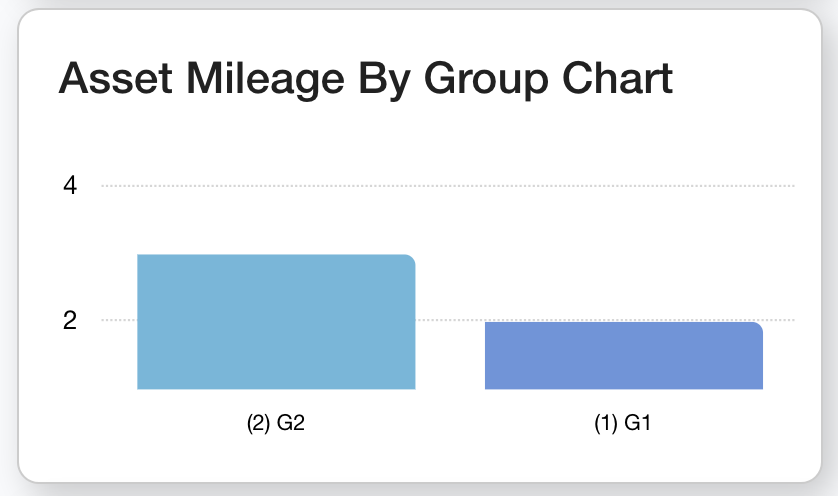
Asset Mileage By Group Chart |
A bar chart to show mileage (odometer readings) by Group. |
Bar Chart |
Asset |
|
|
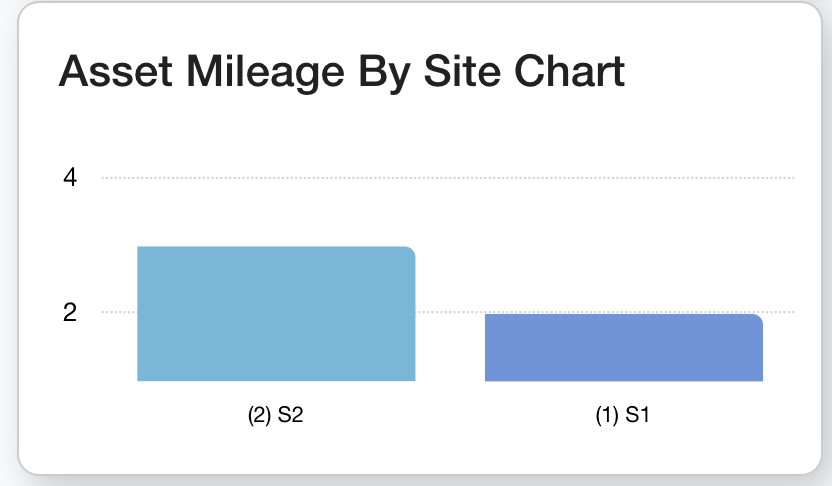
Asset Mileage By Site Chart |
A bar chart to show mileage (odometer readings) by Site. |
Bar Chart |
Asset, Site |
|
|
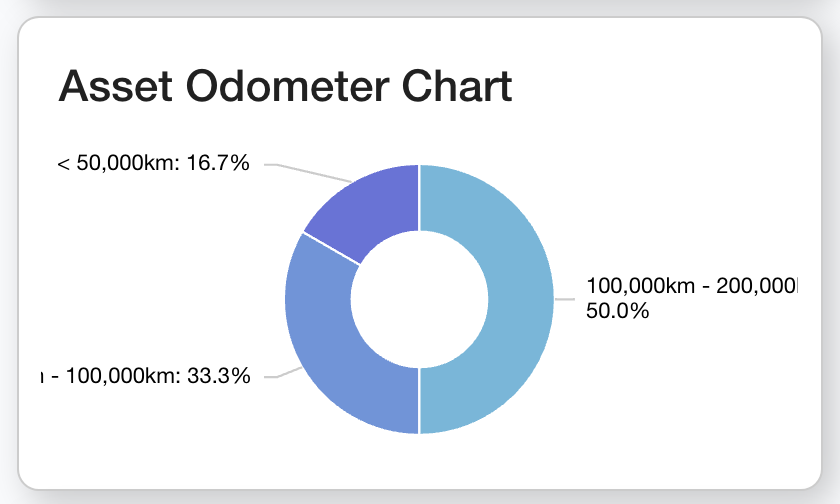
Asset Odometer Chart |
A pie chart showing the total assets in different bands of odometer readings. |
Donut Chart |
Asset |
|
|
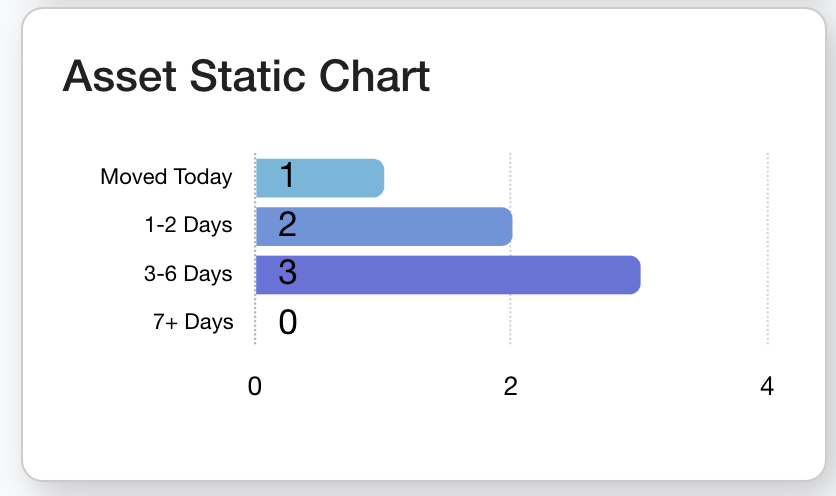
Asset Static Chart |
A horizontal chart showing the total assets in different bands of static days. |
Horizonal Bar Chart |
Asset |
|
|
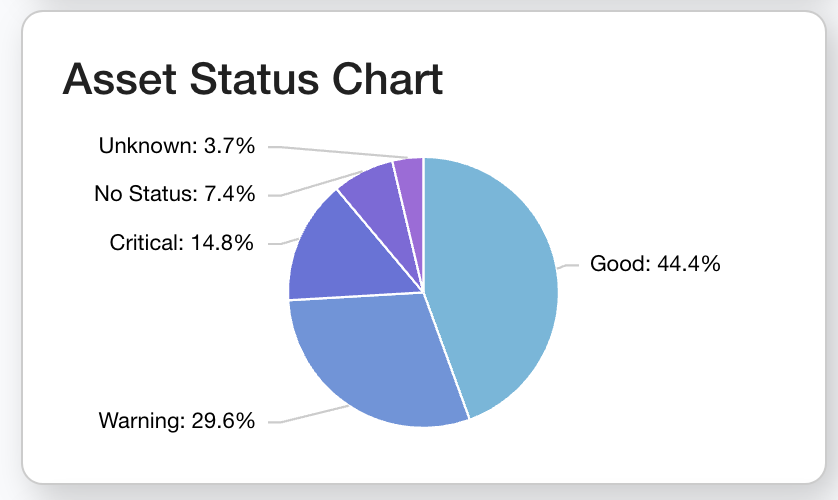
Asset Status Chart |
A pie chart showing the total assets which have a status of critical, warning, good, or unknown. |
Pie Chart |
Asset |
|
|
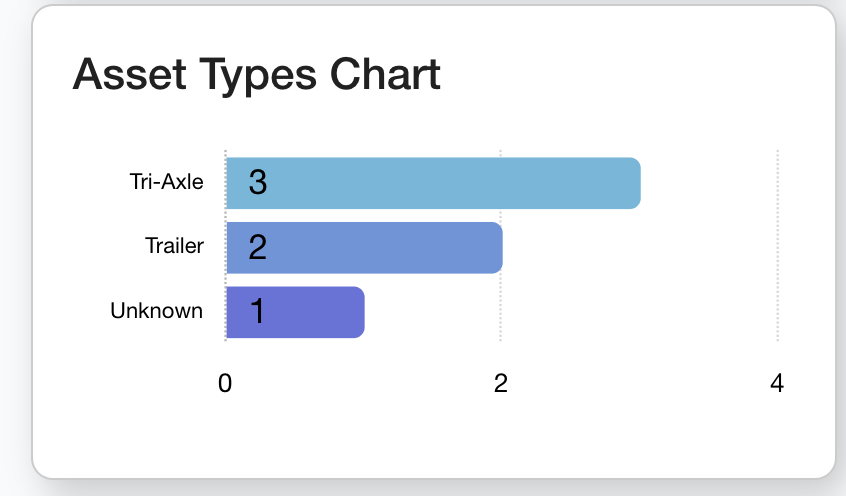
Asset Types Chart |
A horizontal chart showing the total number of each type of asset. |
Horizonal Bar Chart |
Asset |
|
|
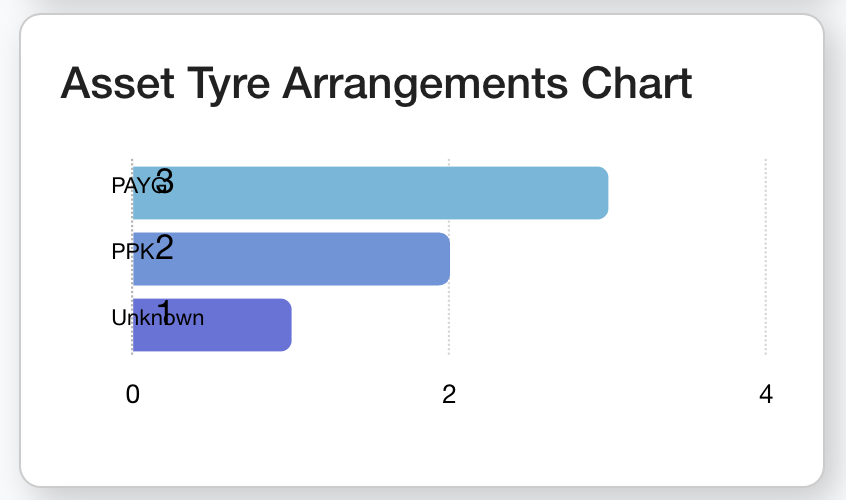
Asset Tyre Arrangements Chart |
A horizontal chart showing the total number of each type of tyre arrangement. |
Horizonal Bar Chart |
Asset |
|
|
Assets Off Road With A Defect |
The total number of assets which have been marked VOR for a defect. |
Card |
Asset, Defect, Maintenance |
|
|
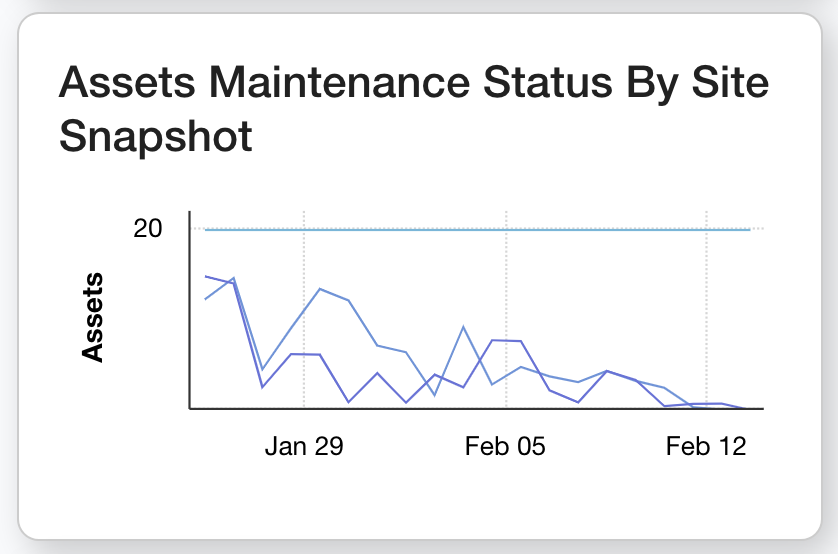
Asset Maintenance Status By Site Snapshot |
A series of lines to show the total of assets with overdue and upcoming maintenance statuses over time. You can add a Site filter to this widget. |
Linear Chart |
Asset, Maintenance, Site |
|
|
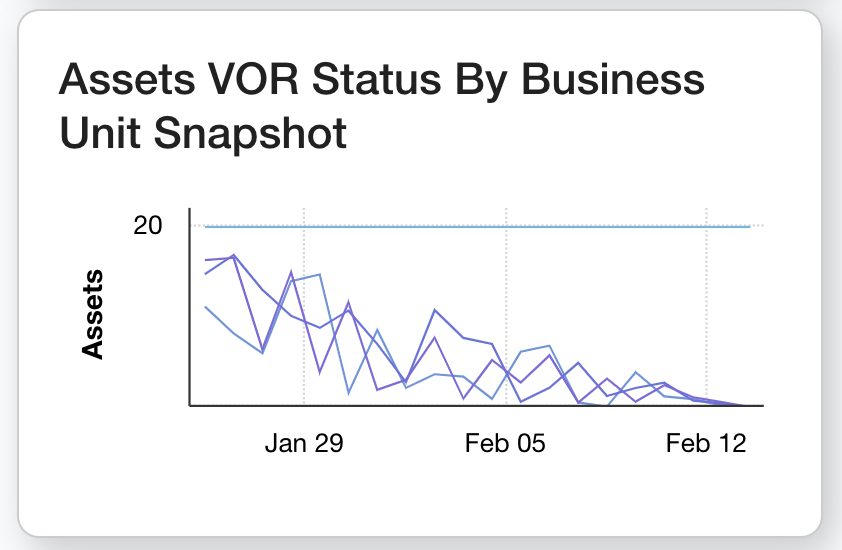
Assets VOR Status By Business Unit Snapshot |
A series of lines to show the total of assets within each VOR status over time. You can add a Business Unit filter to this widget. |
Linear Chart |
Asset |
|
|
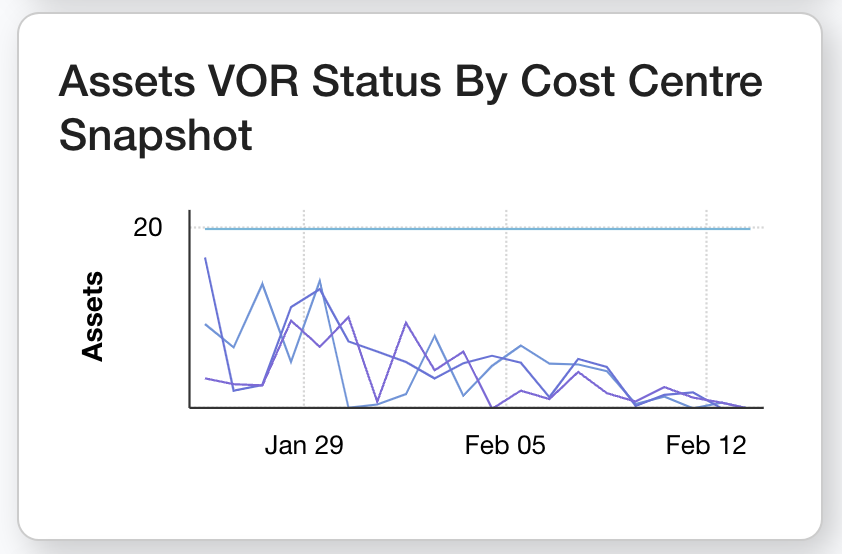
Assets VOR Status By Cost Centre Snapshot |
A series of lines to show the total of assets within each VOR status over time. You can add a Cost Centre filter to this widget. |
Linear Chart |
Asset |
|
|
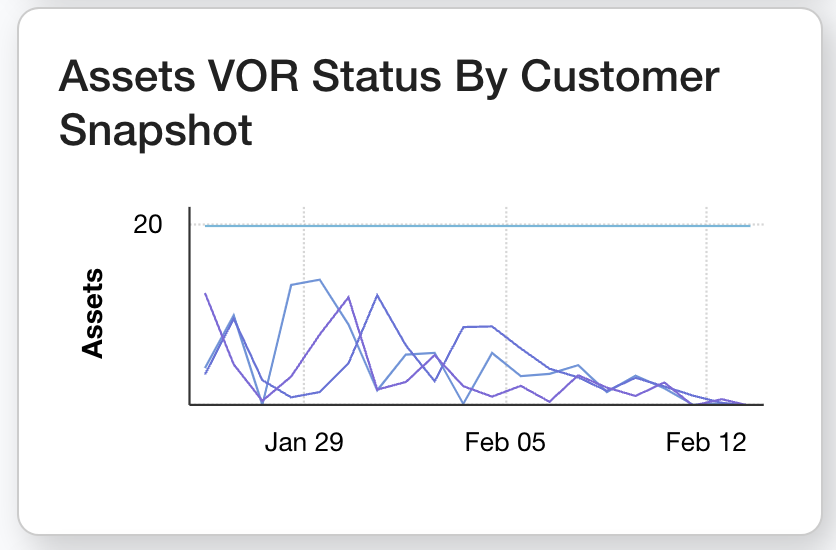
Assets VOR Status By Customer Snapshot |
A series of lines to show the total of assets within each VOR status over time. You can add a Customer filter to this widget. |
Linear Chart |
Asset |
|
|
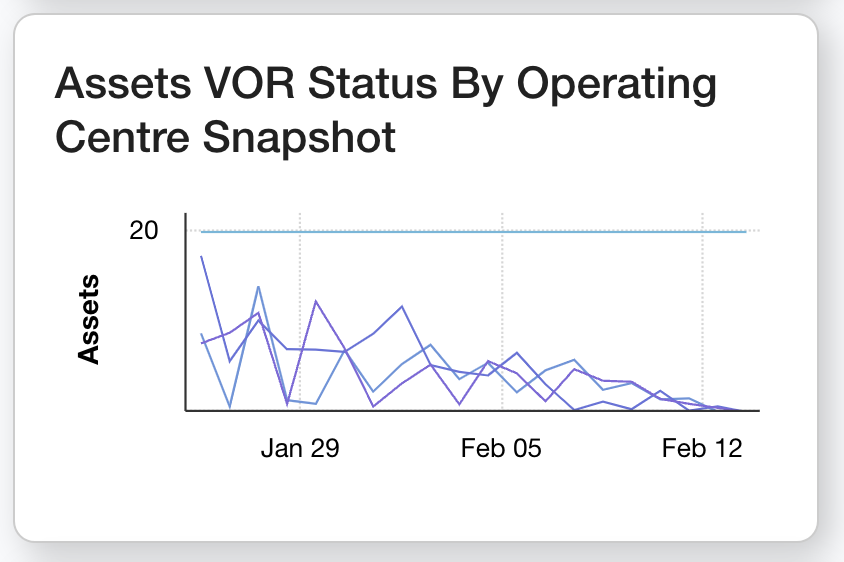
Assets VOR Status By Operating Centre Snapshot |
A series of lines to show the total of assets within each VOR status over time. You can add an Operating Centre filter to this widget. |
Linear Chart |
Asset |
|
|
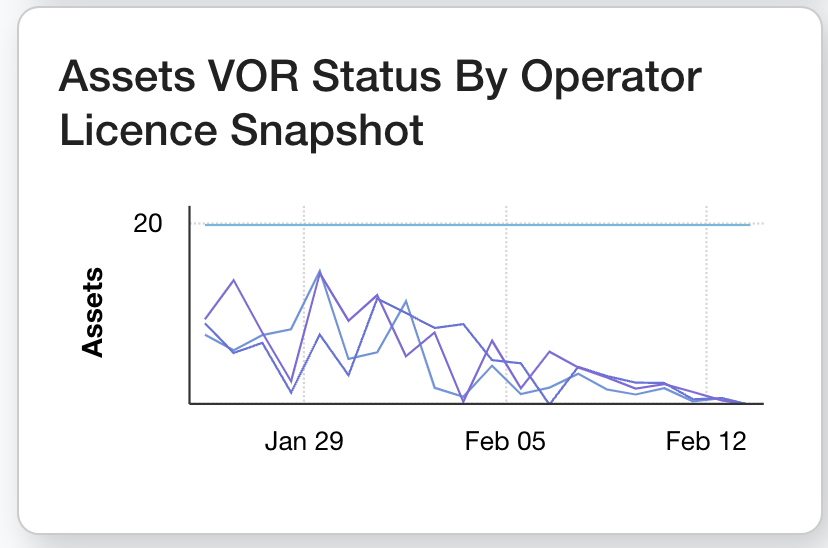
Assets VOR Status By Operator License Snapshot |
A series of lines to show the total of assets within each VOR status over time. You can add an Operator License filter to this widget. |
Linear Chart |
Asset |
|
|
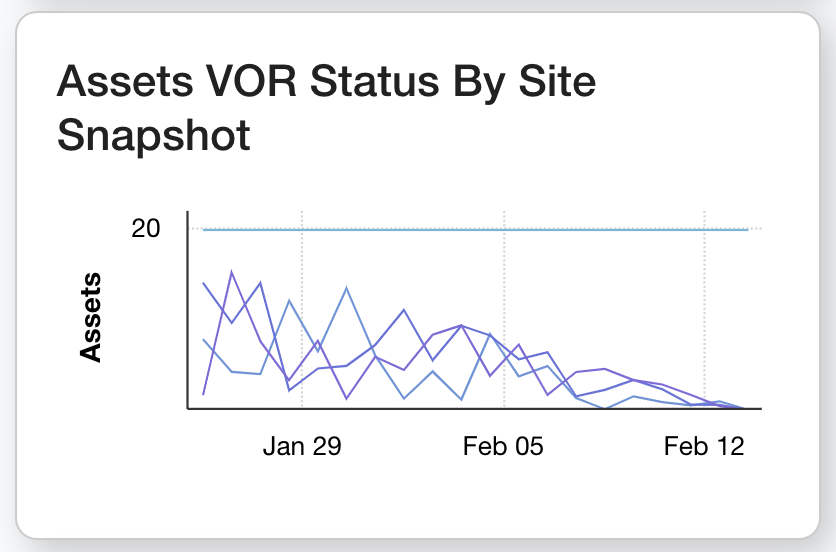
Assets VOR Status By Site Snapshot |
A series of lines to show the total of assets within each VOR status over time. You can add an Site filter to this widget. |
Linear Chart |
Asset, Site |
|
|
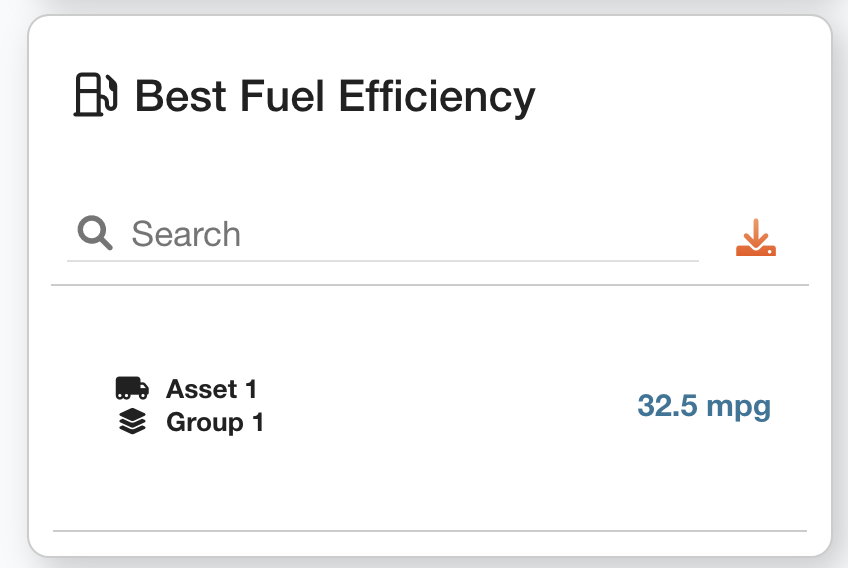
Best Fuel Efficiency |
A list of assets with the latest MPG, sorted in Descending Order (best MPG at the top). |
List |
Asset, Fuel Efficiency |
|
|
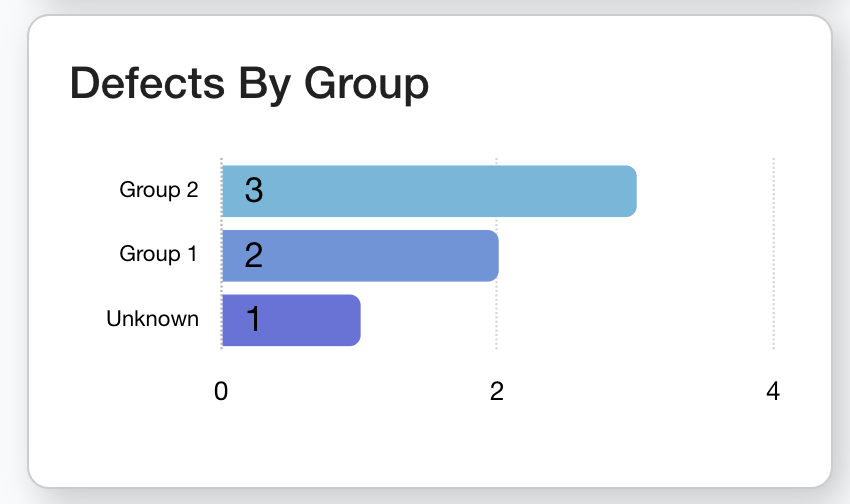
Defects By Group |
Total number of Asset Record Defects reported by each group. |
Horizontal Bar Chart |
Defect |
|
|
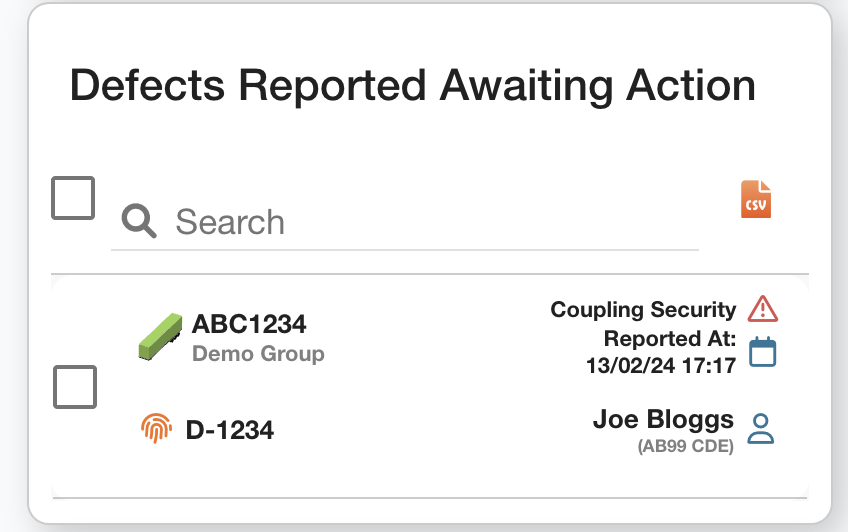
Defects Reported Awaiting Action |
A list of Defects reported which are still awaiting action. |
List |
Defect |
|
|
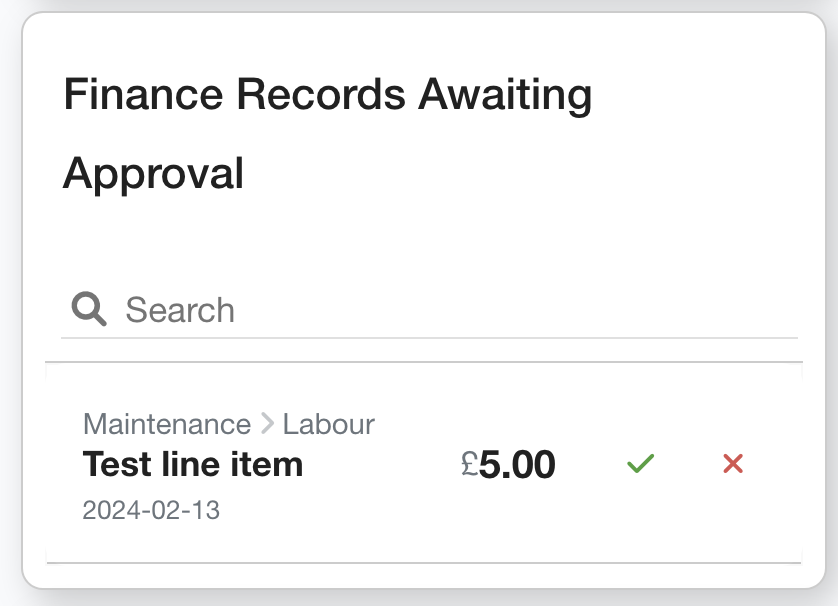
Finance Records Awaiting Approval |
A tabular list of all finance records awaiting approval, including controls to approve or decline. |
List |
Finance |
|
|
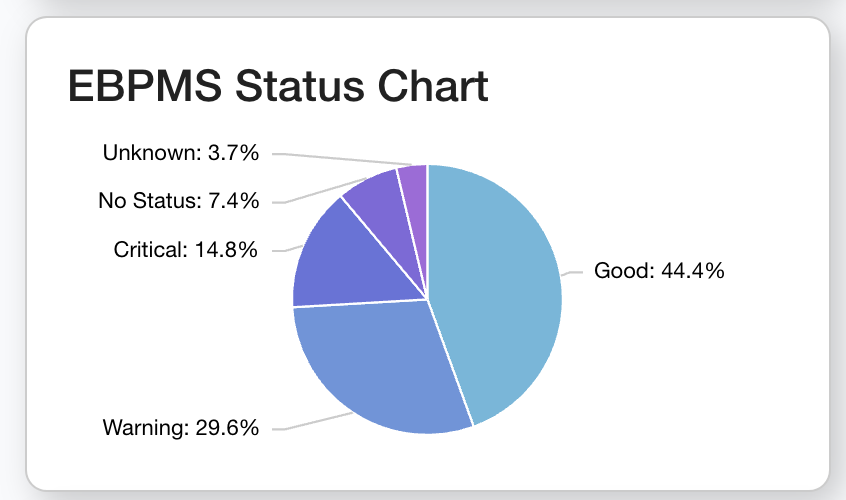
EBPMS Status Chart |
A pie chart showing the total assets which have an EBPMS status of critical, warning, good, or unknown. |
Pie Chart |
Asset |
|
|
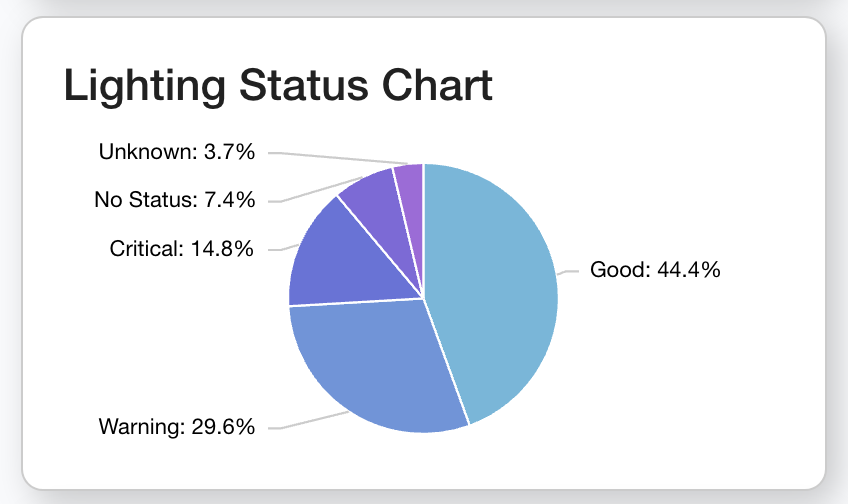
Lighting Status Chart |
A pie chart showing the total assets which have a Lighting status of critical, warning, good, or unknown. |
Pie Chart |
Asset |
|
|
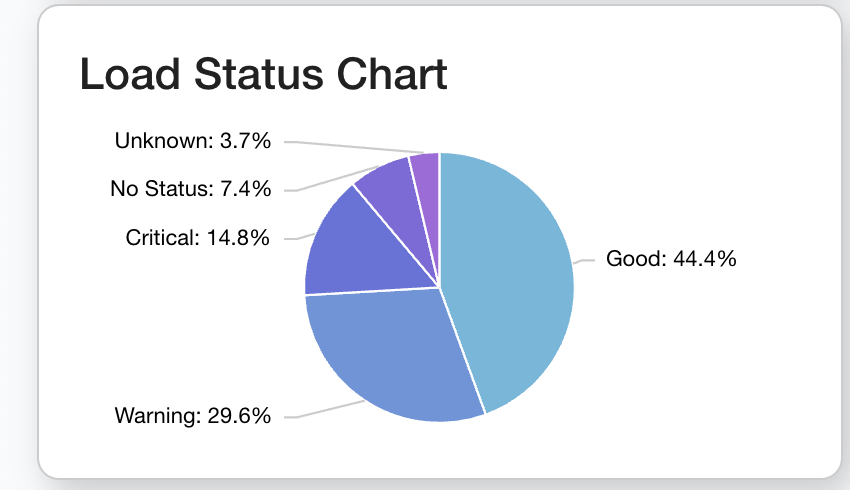
Load Status Chart |
A pie chart showing the total assets which have a Load status of critical, warning, good, or unknown. |
Pie Chart |
Asset |
|
|
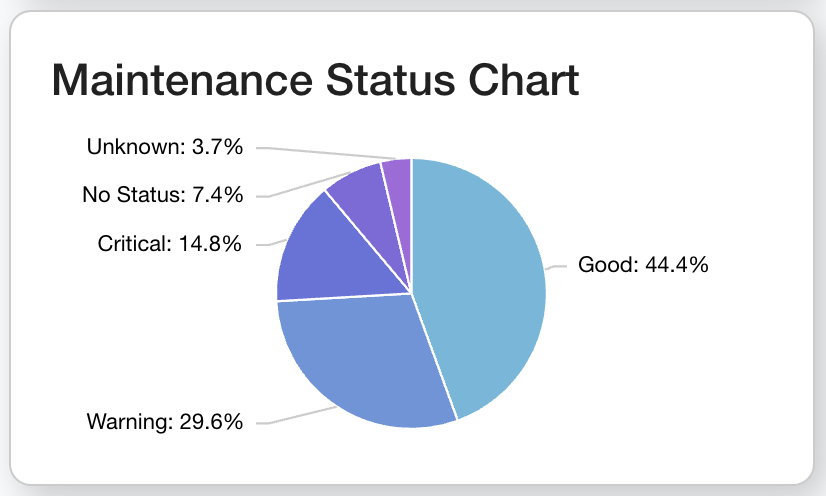
Maintenance Status Chart |
A pie chart showing the total assets which have a Maintenance status of critical, warning, good, or unknown. |
Pie Chart |
Asset |
|
|
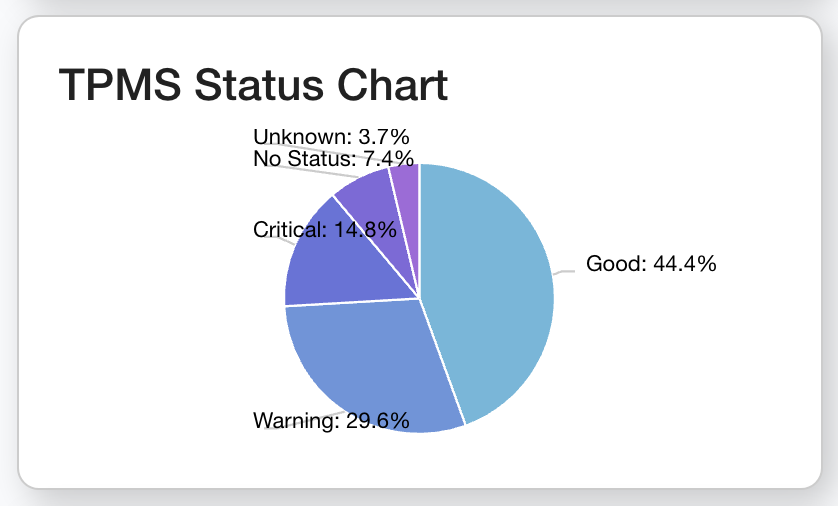
TPMS Status Chart |
A pie chart showing the total assets which have a TPMS status of critical, warning, good, or unknown. |
Pie Chart |
Asset, TPMS |
|
|
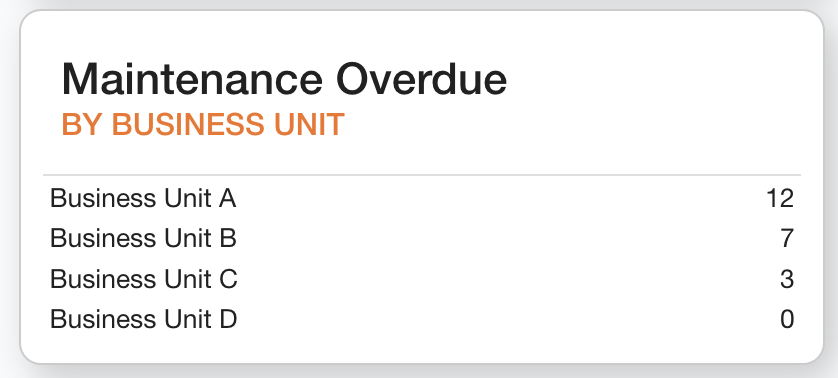
Maintenance Overdue By Business Unit |
A table showing the total of overdue** maintenance events for each business unit. |
Table |
Maintenance |
|
|
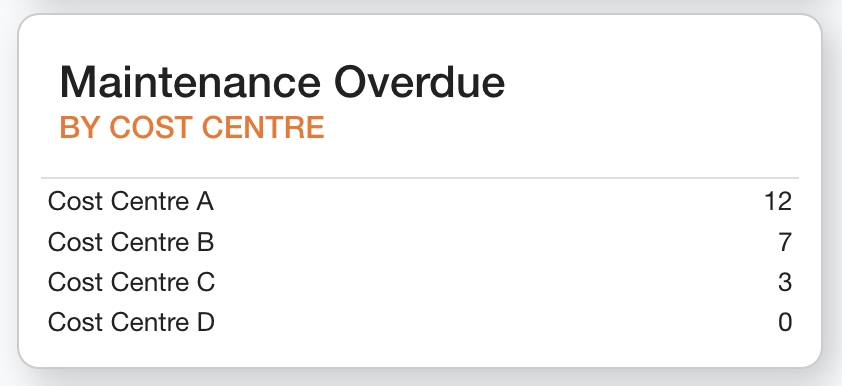
Maintenance Overdue By Cost Centre |
A table showing the total of overdue** maintenance events for each cost centre. |
Table |
Maintenance |
|
|
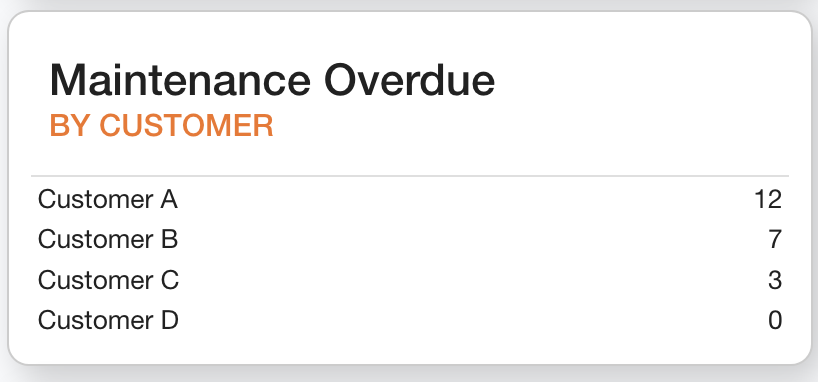
Maintenance Overdue By Customer |
A table showing the total of overdue** maintenance events for each customer. |
Table |
Maintenance |
|
|
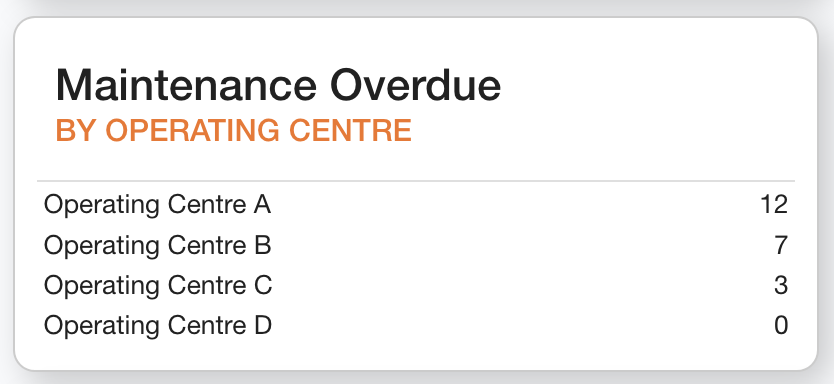
Maintenance Overdue By Operating Centre |
A table showing the total of overdue** maintenance events for each operating centre. |
Table |
Maintenance |
|
|
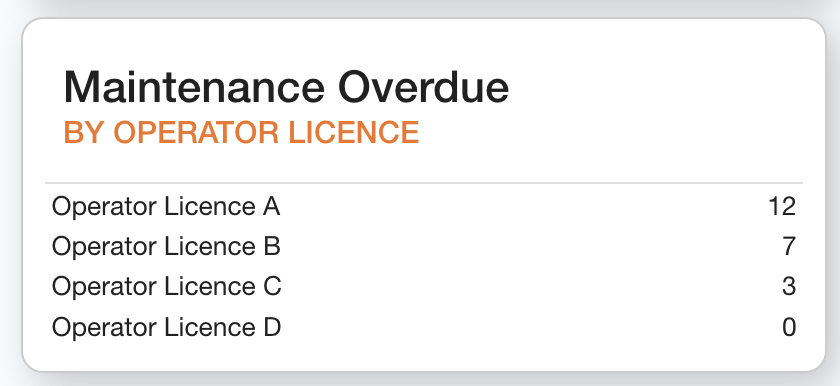
Maintenance Overdue By Operator License |
A table showing the total of overdue** maintenance events for each operator license. |
Table |
Maintenance |
|
|
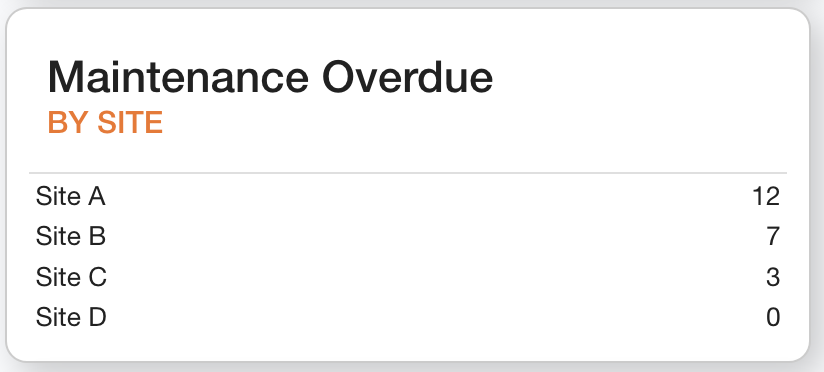
Maintenance Overdue By Site |
A table showing the total of overdue** maintenance events for each site. |
Table |
Maintenance, Site |
|
|
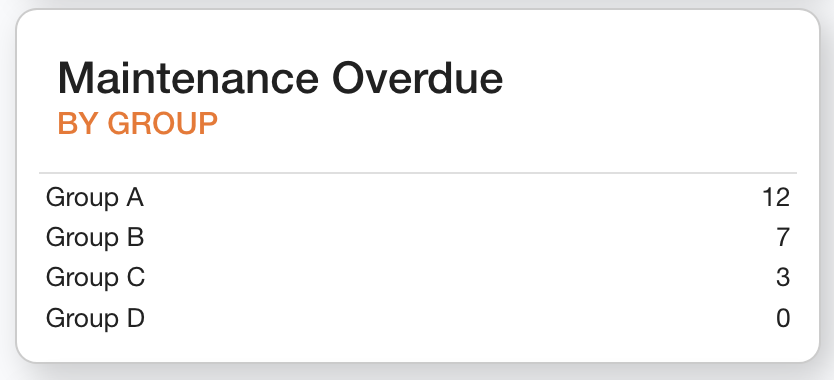
Maintenance Overdue By Group |
A table showing the total of overdue** maintenance events for each group. |
Table |
Maintenance |
|
|
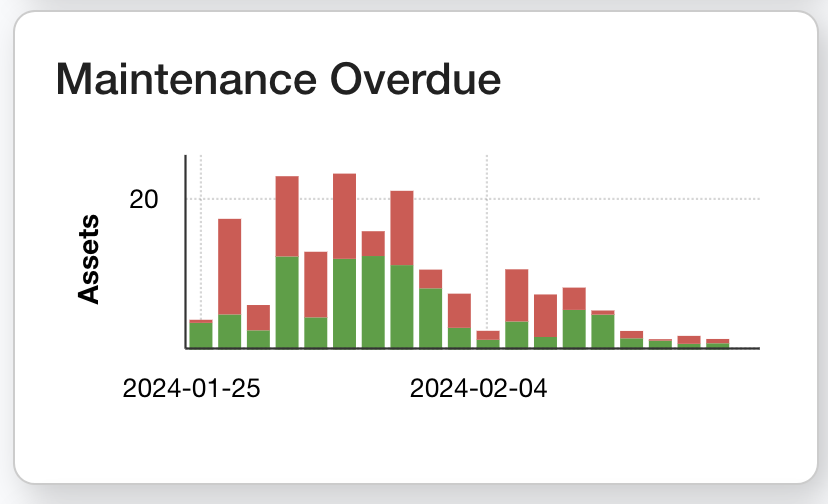
Maintenance Overdue |
A staggered bar chart to show maintenance events overdue (both complete and incomplete), grouped by Site. |
Stacked Bar Chart |
Maintenance, Site |
|
|
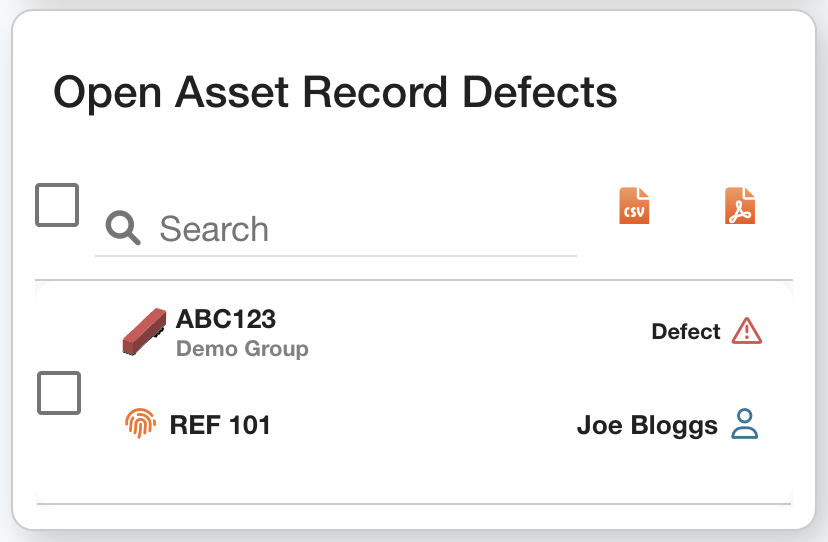
Open Asset Record Defects |
A list of Asset Record Defects reported which have not got a completed date. |
List |
Maintenance, Defect |
|
|
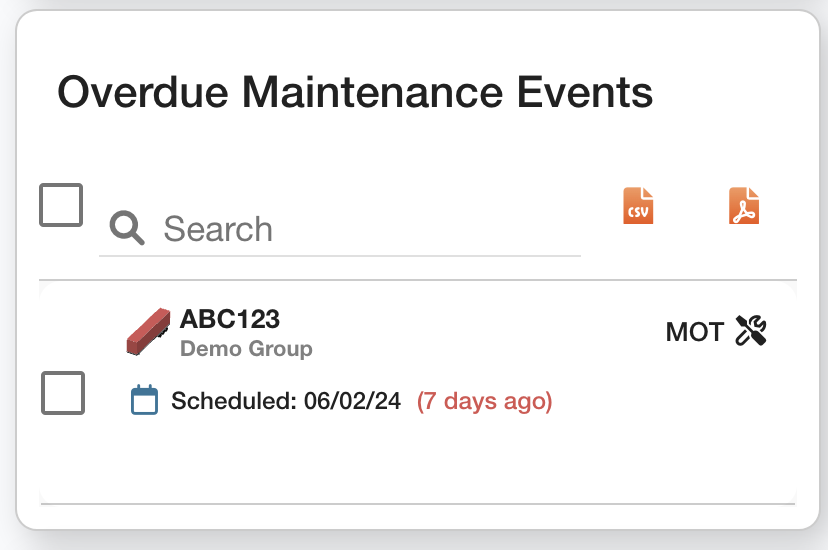
Overdue Maintenance Events |
A list of Asset Record Events which are overdue** |
List |
Maintenance |
|
|
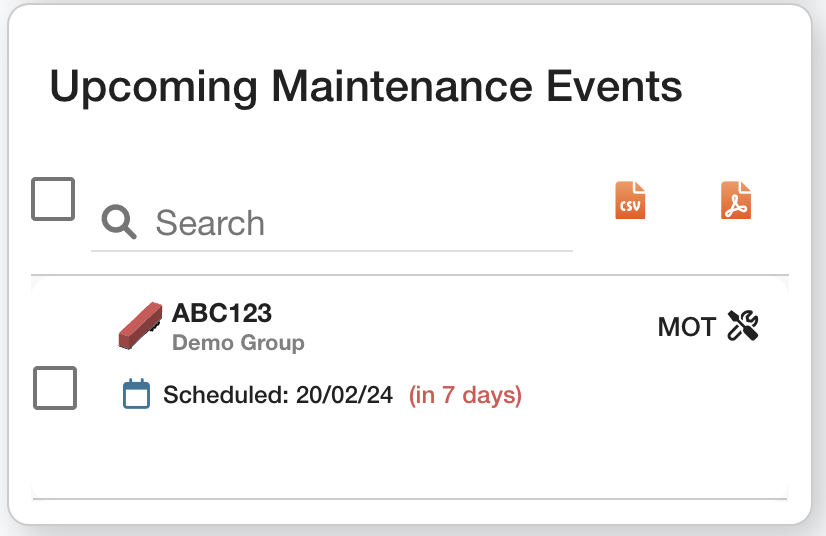
Upcoming Maintenance Events |
A list of Asset Record Events which are due soon** |
List |
Maintenance |
|
|
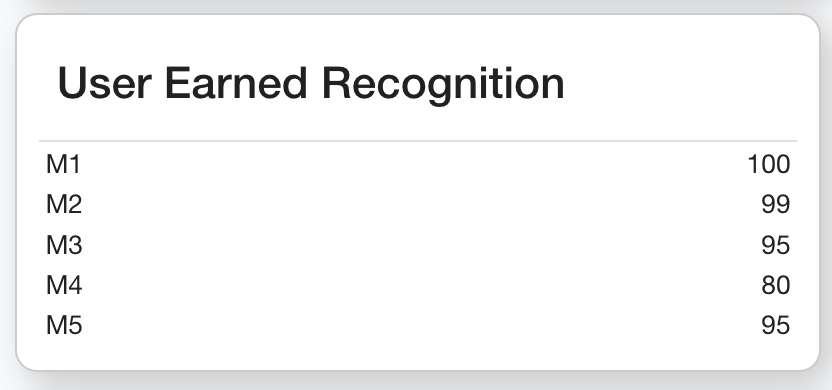
User Earned Recognition |
A table showing each Earned Regoncition criteria, and your fleets score against each. |
Table |
Maintenance |
|
|
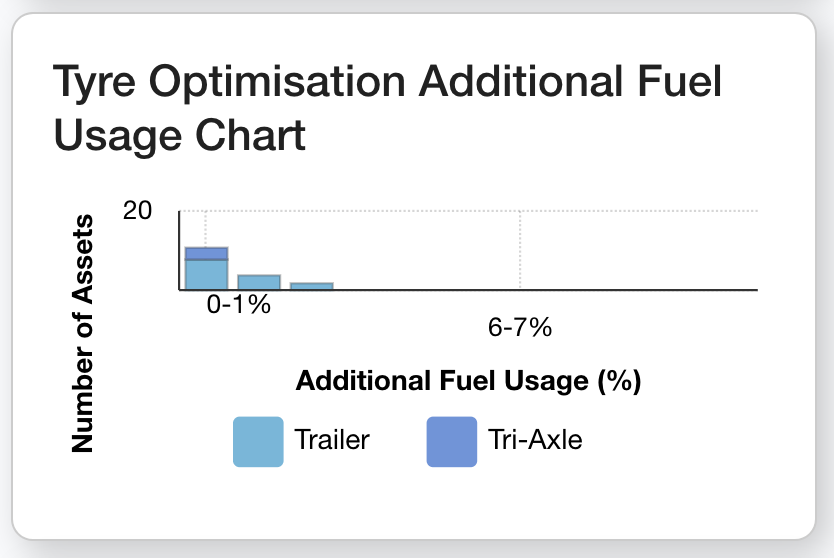
Tyre Optimisation Additional Fuel Usage Chart |
A chart showing the total assets that fall within bands of estimated additional fuel usage due to tyres not inflated at the optimal PSI. |
Stacked Bar Chart |
Asset, TPMS |
|
|
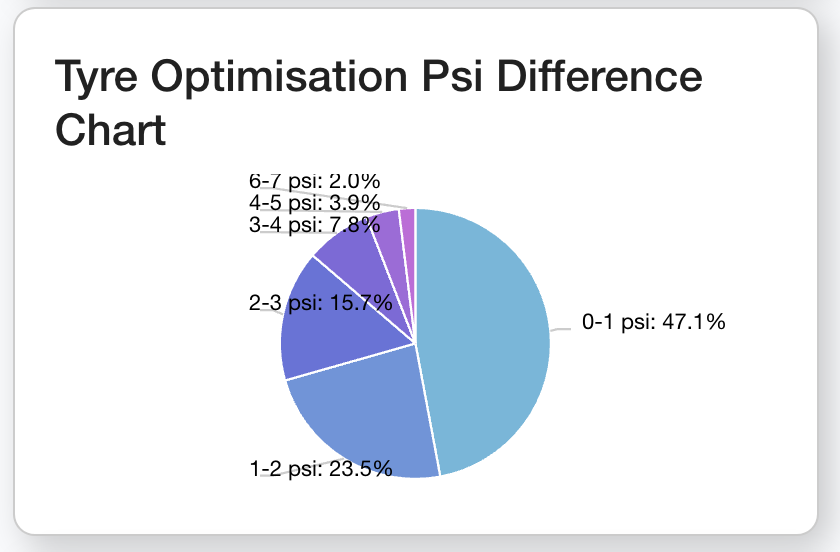
Tyre Optimisation PSI Difference Chart |
A pie chart to show the percentage of tyres which fall within bands of difference between their actual and ideal PSI. |
Pie Chart |
Asset, TPMS |
|
|
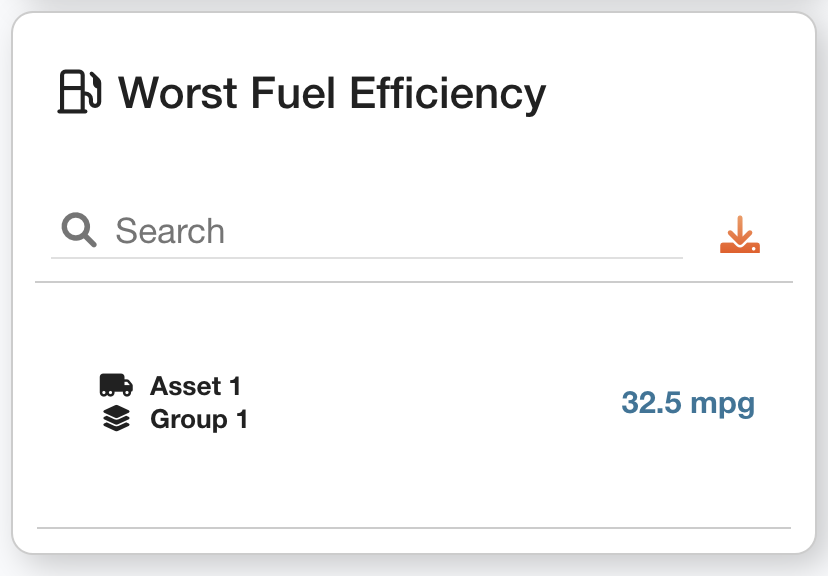
Worst Fuel Efficiency |
A list of assets with the latest MPG, sorted in Ascending Order (worst MPG at the top). |
List |
Asset, Fuel Efficiency |
|
† the purpose of the filter may change slightly if filters have been applied. For example, Asset Total might have a filter applied to show the total of assets in a certain group.
**the ‘Due Soon’ and ‘Overdue' periods will have been configured with the schedule set up for each asset.