.png)
Electronic Brake Performance Monitoring (EBPMS)
EBPMS® is a useful tool for providing dynamic, live monitoring of your trailer’s braking performance. EBPMS has been included in the DVSA’s Guide to Roadworthiness, which was written in association with Axscend. By knowing how to properly utilise the EBPMS section you can stay compliant, reduce downtime, and replace laden roller brake testing with EBPMS.
EBPMS works by:
Monitoring and recording every brake event as it happens.
This data is adjusted to account for variables such as road angle and bogie weight.
The resulting data is plotted in an easy to read graph against the DVSA pass mark.
Follow the link for more information about TrailerMaster EBPMS.
To navigate to the EBPMS section, ensure you are on the Asset Dashboard page of the asset you want to view. On the Asset Dashboard page, inside the EBPMS section on the left sidebar click on the ‘Brake Performance' button to open the EBPMS - Brake Performance page.
If you do not have an EBPMS section in your asset’s dashboard your company or the asset may not have this feature enabled yet.
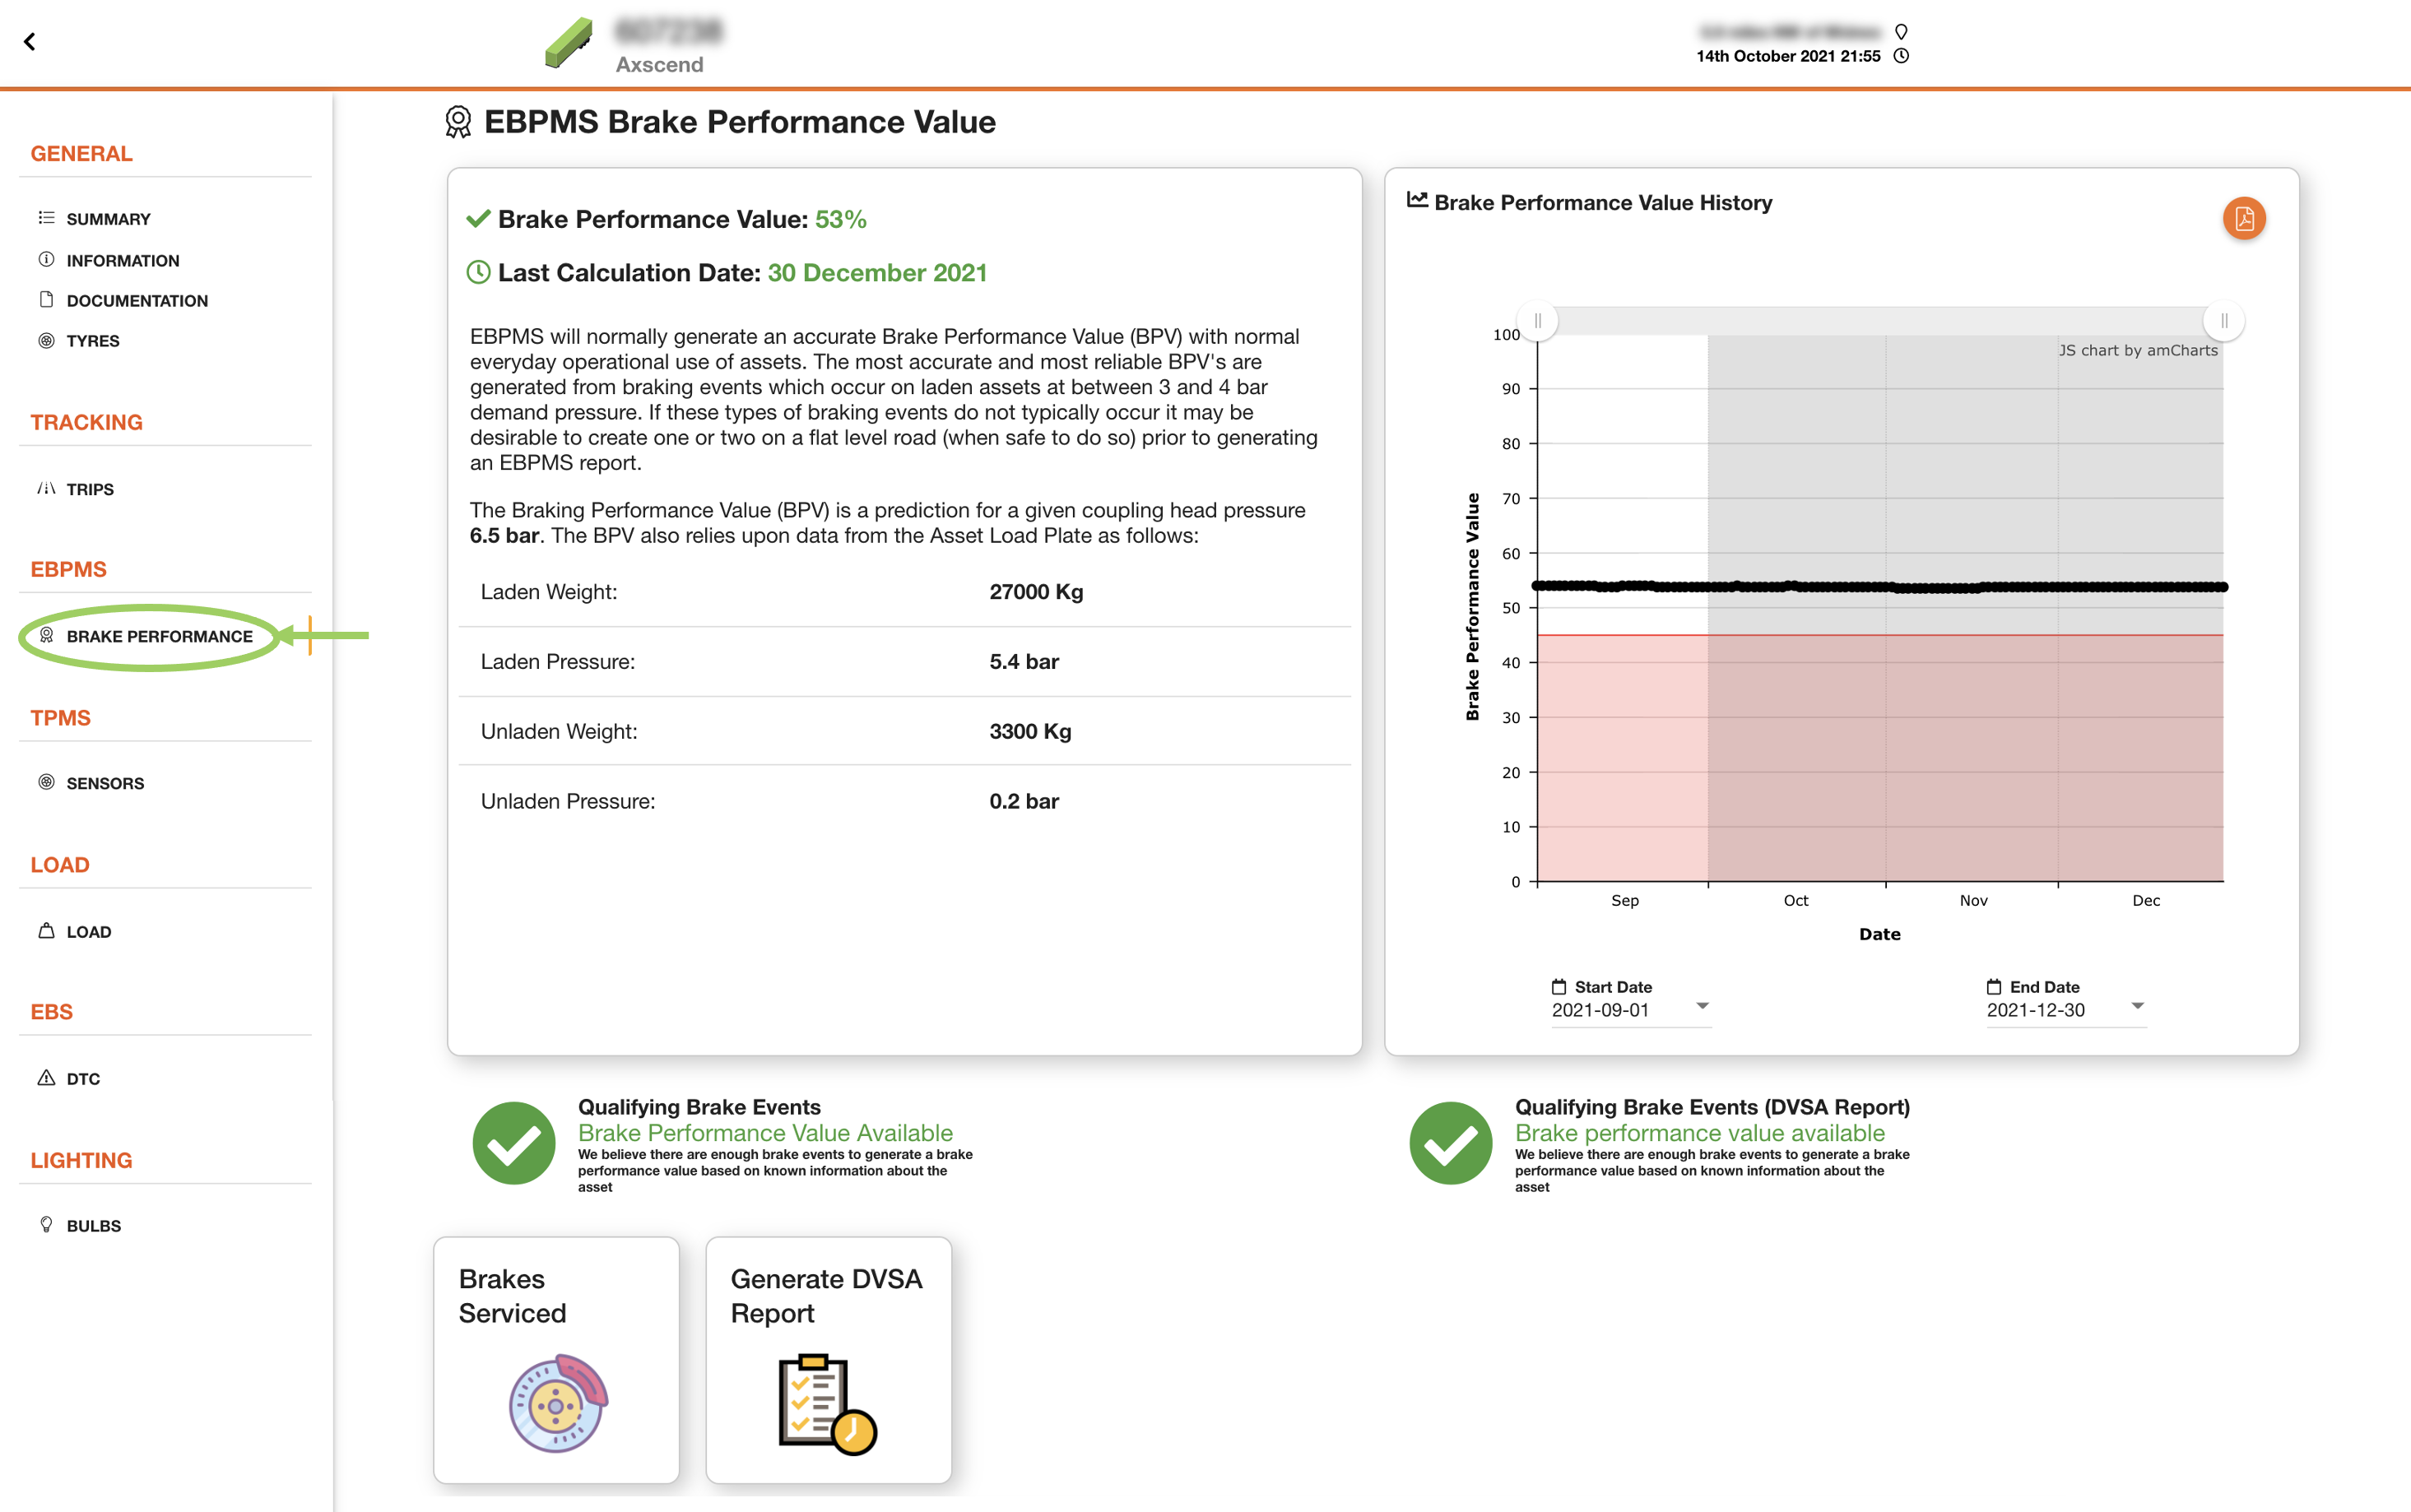
The EBPMS page is made up of:
Textual Summary
EBPMS Graph
Qualifying Brake Events Summary
Controls
Brakes Serviced
Generating Reports
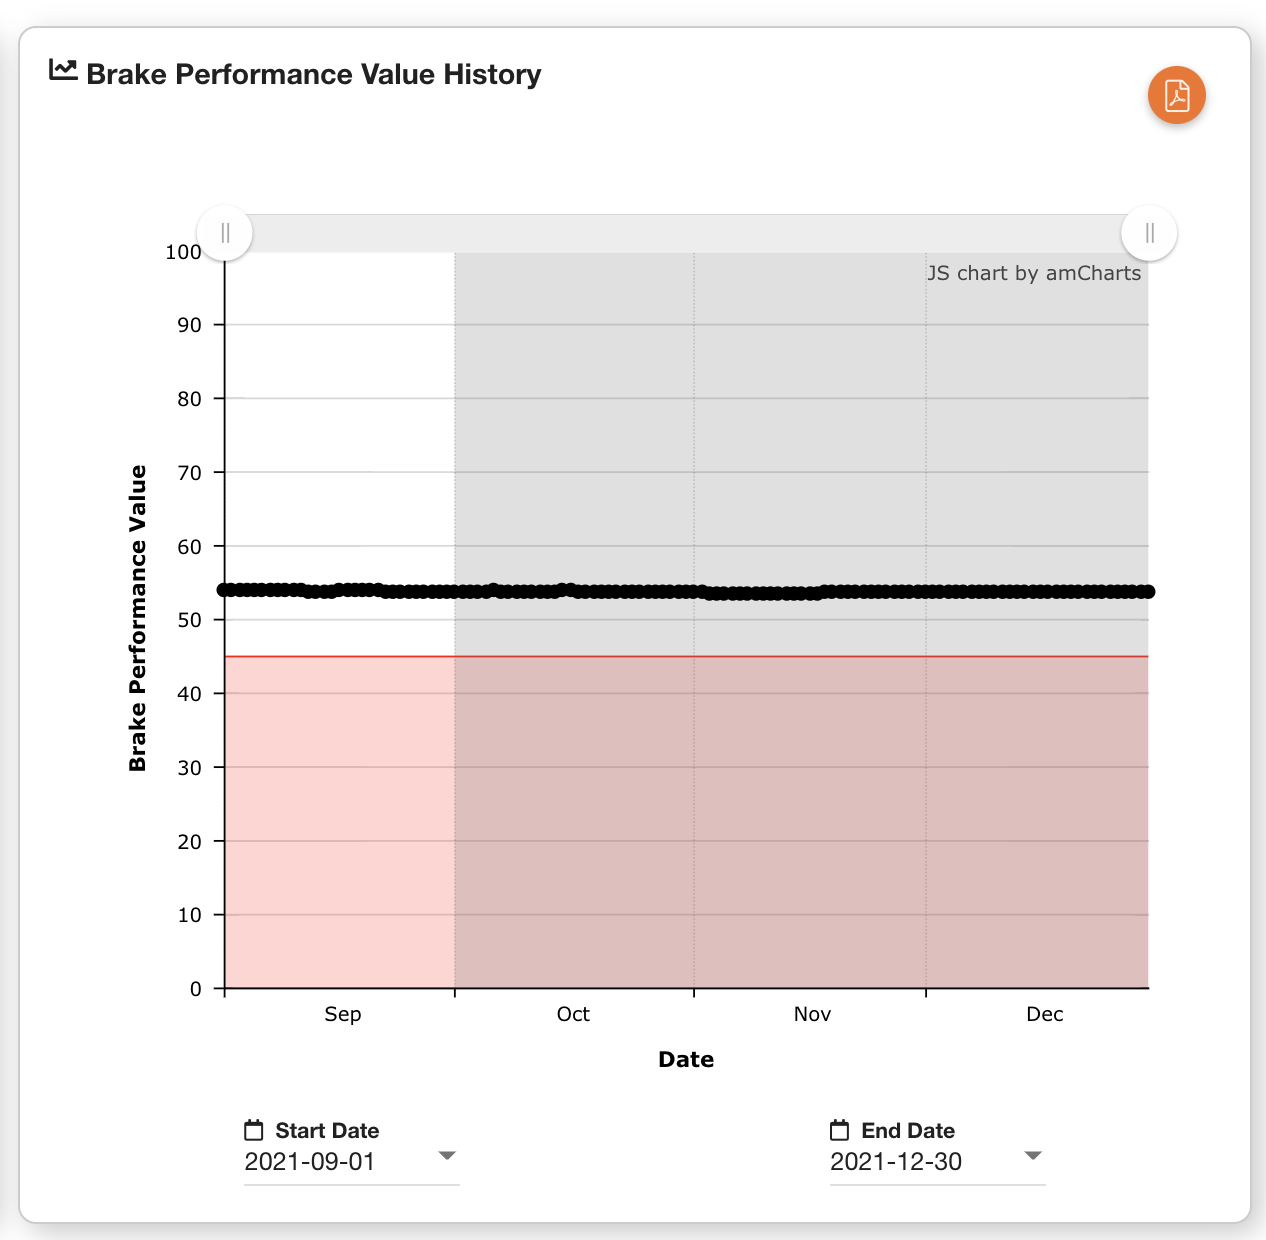
EBPMS Graph
The EBPMS Graph shows the plotted Brake Performance Values across a date range. The Brake Performance Value is the assessment of every brake event which occurred during a range (default 56 days, but can be specified by your company) during operational use of assets. The plotted Brake Performance Values are compared to the DVSA pass mark of 45%, which is illustrated with the shaded red region of the graph.
You can hover over any point of the graph to view more information about the plotted value. | 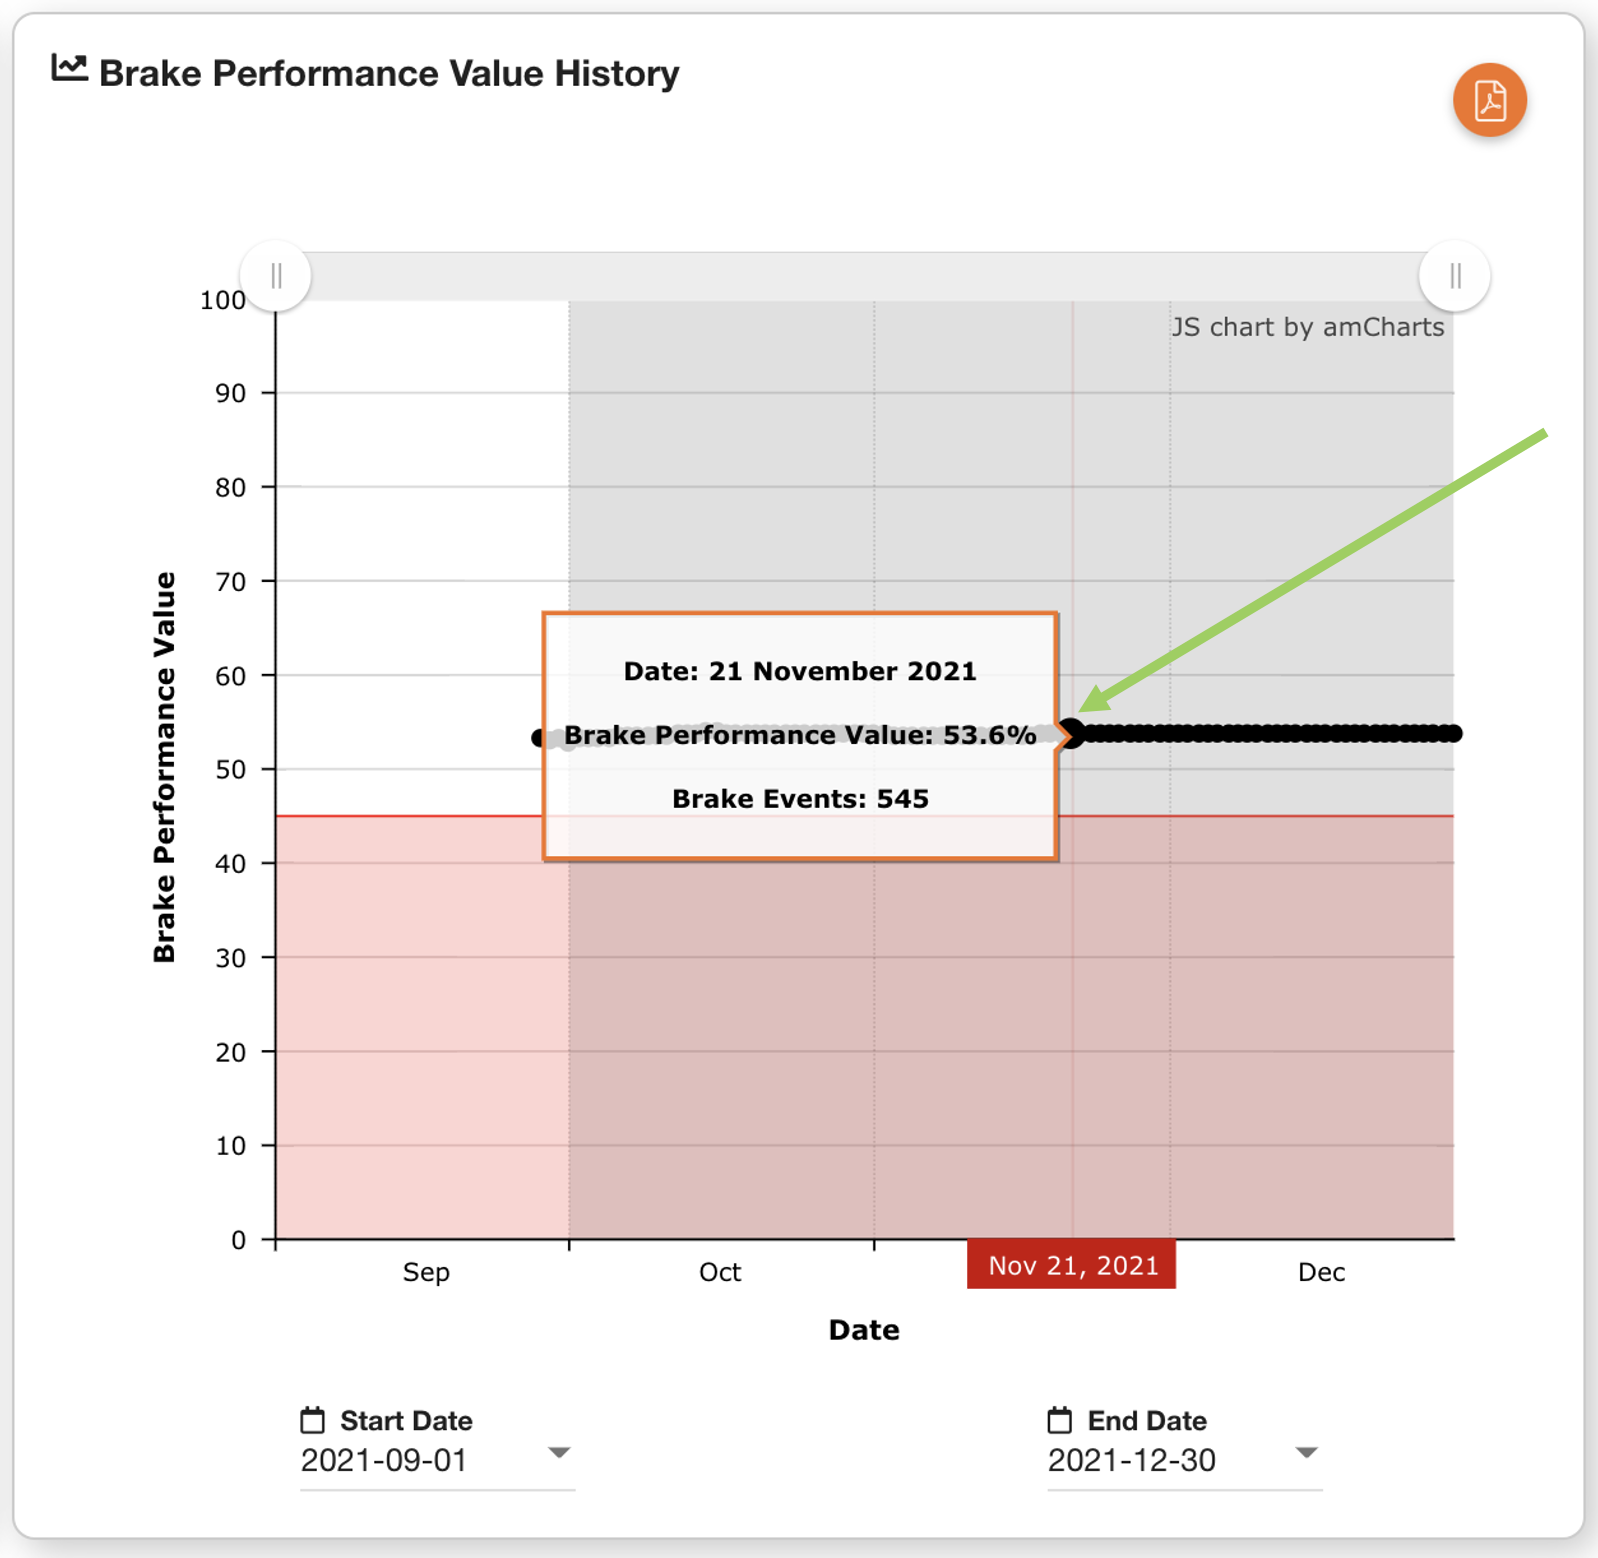 |
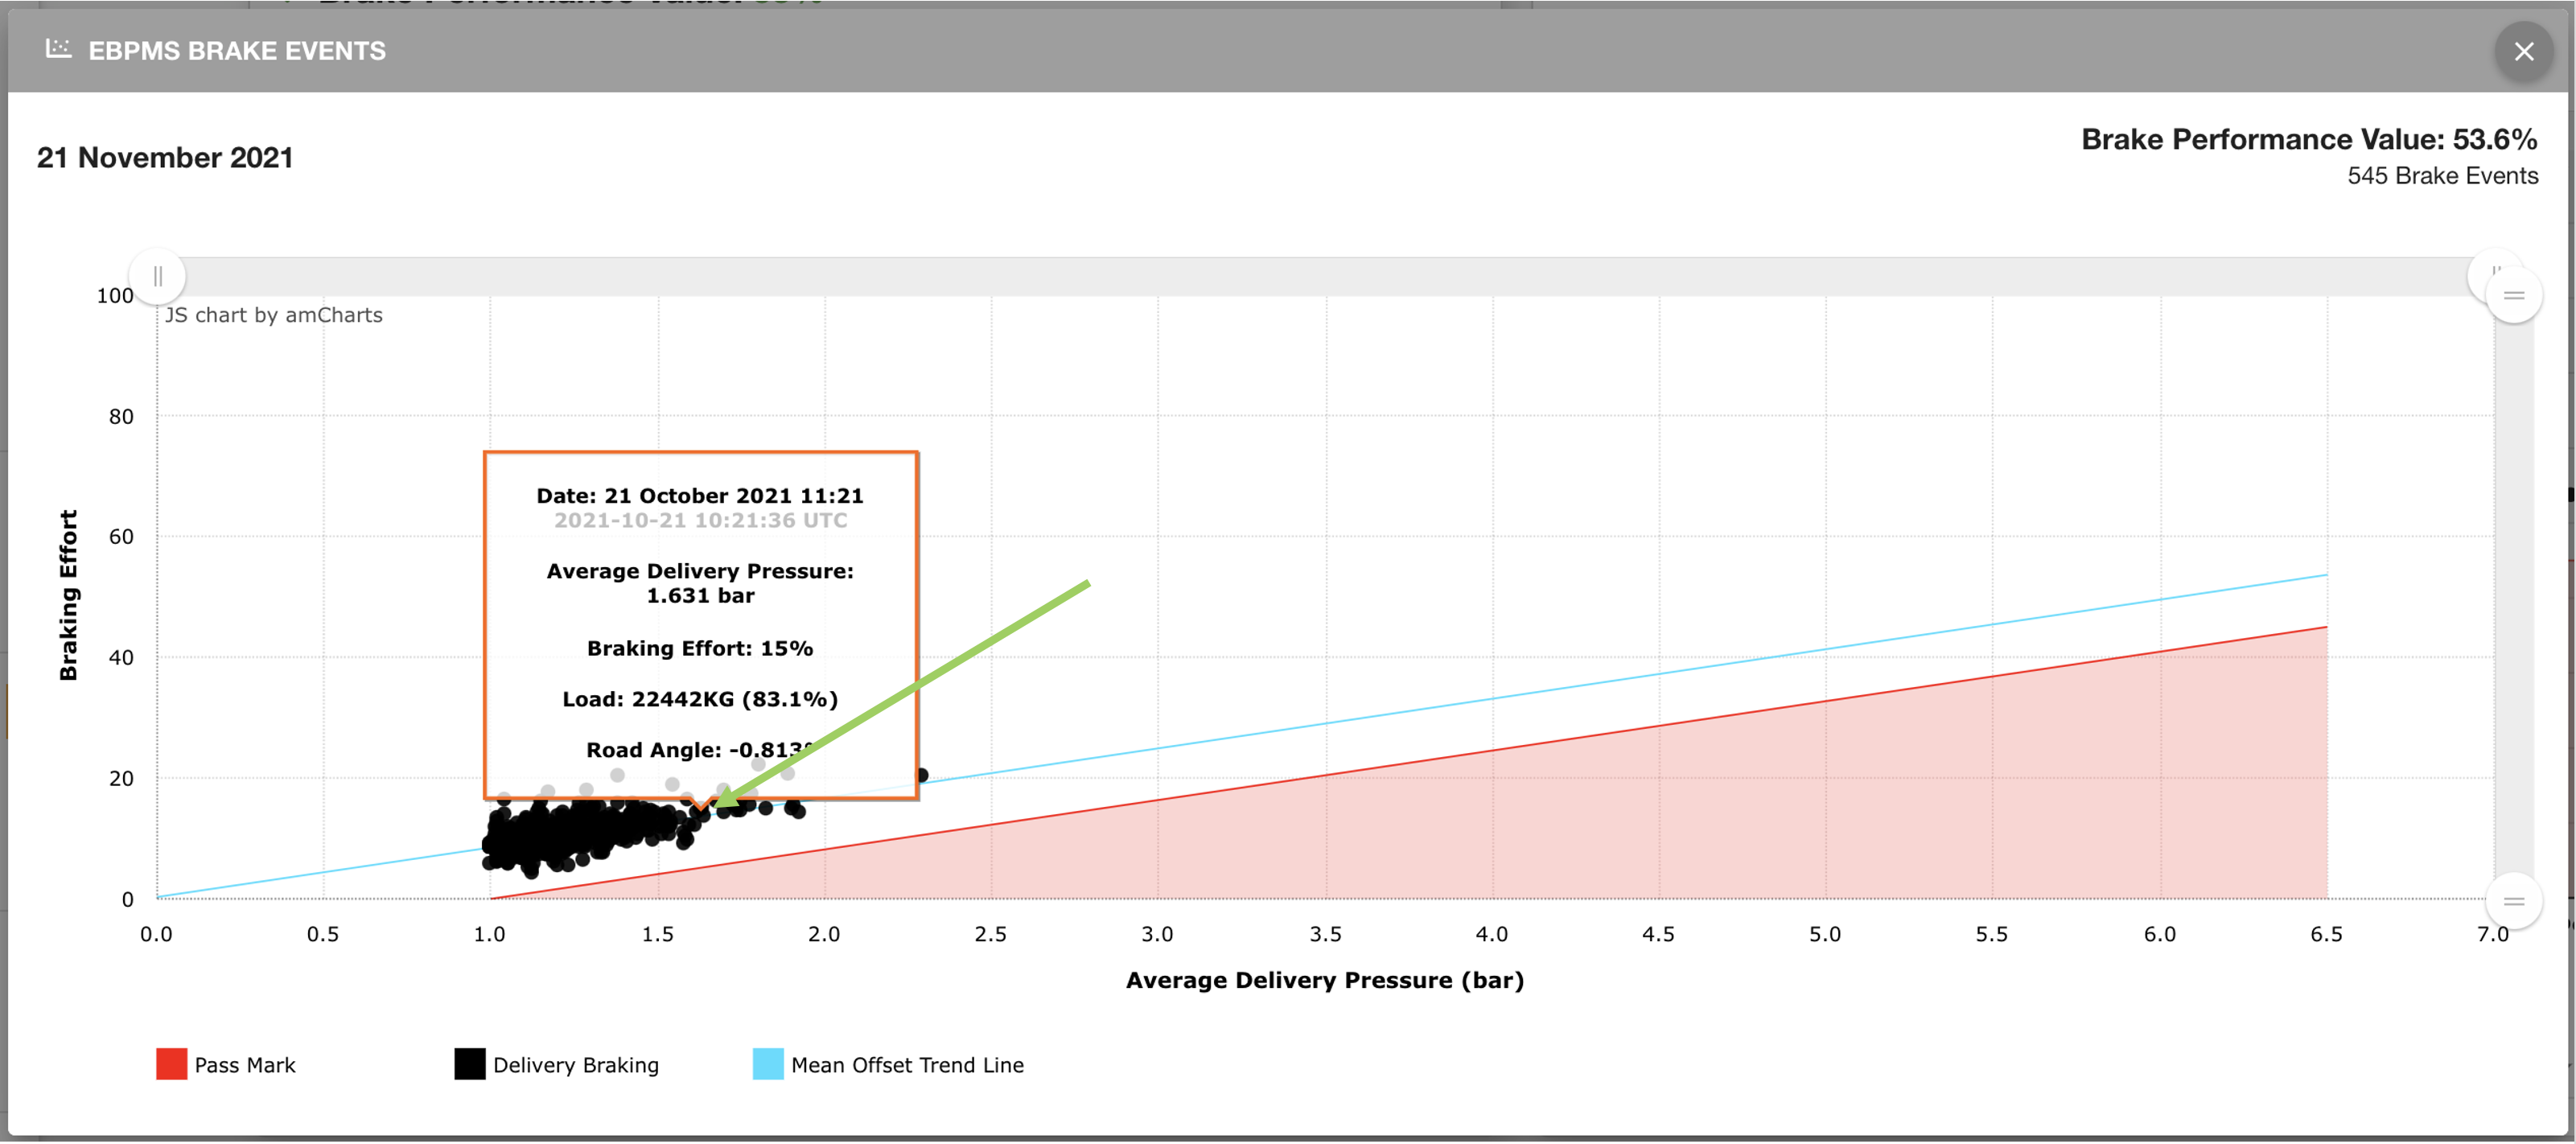
You can click on any point of the graph to view a more detailed insight on that Brake Performance Value. Clicking on the point above will open a dialog box with a new graph breaking down the data which was used to calculate the Brake Performance Value recorded on the 21st of November.
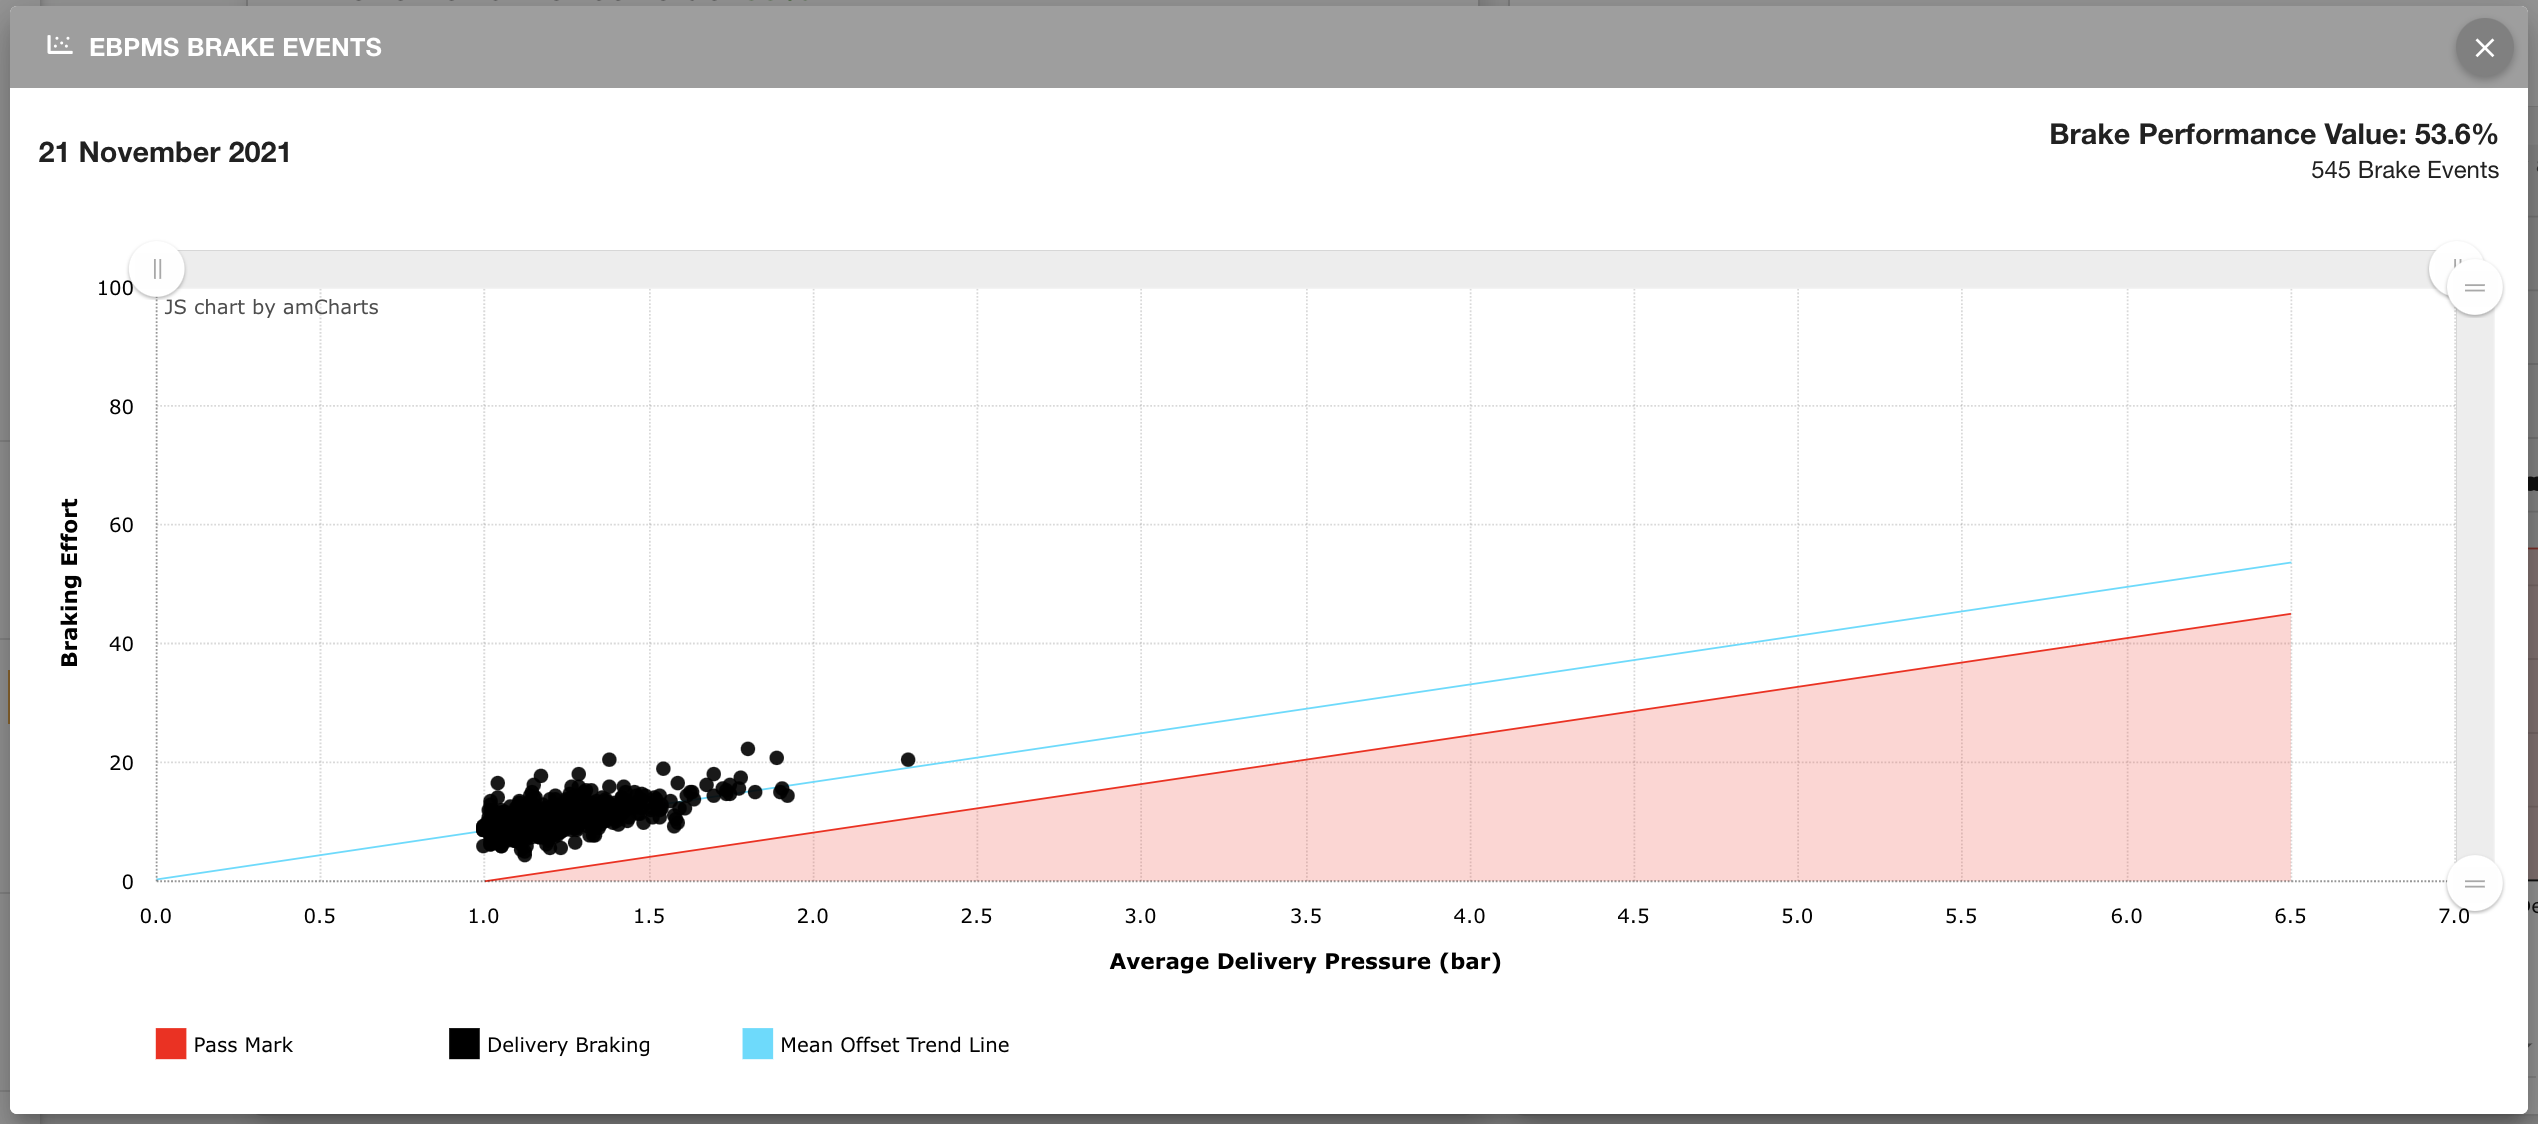
Again, similar to the EBPMS BPV graph, you can hover over any point of the graph to view more information about the plotted value.
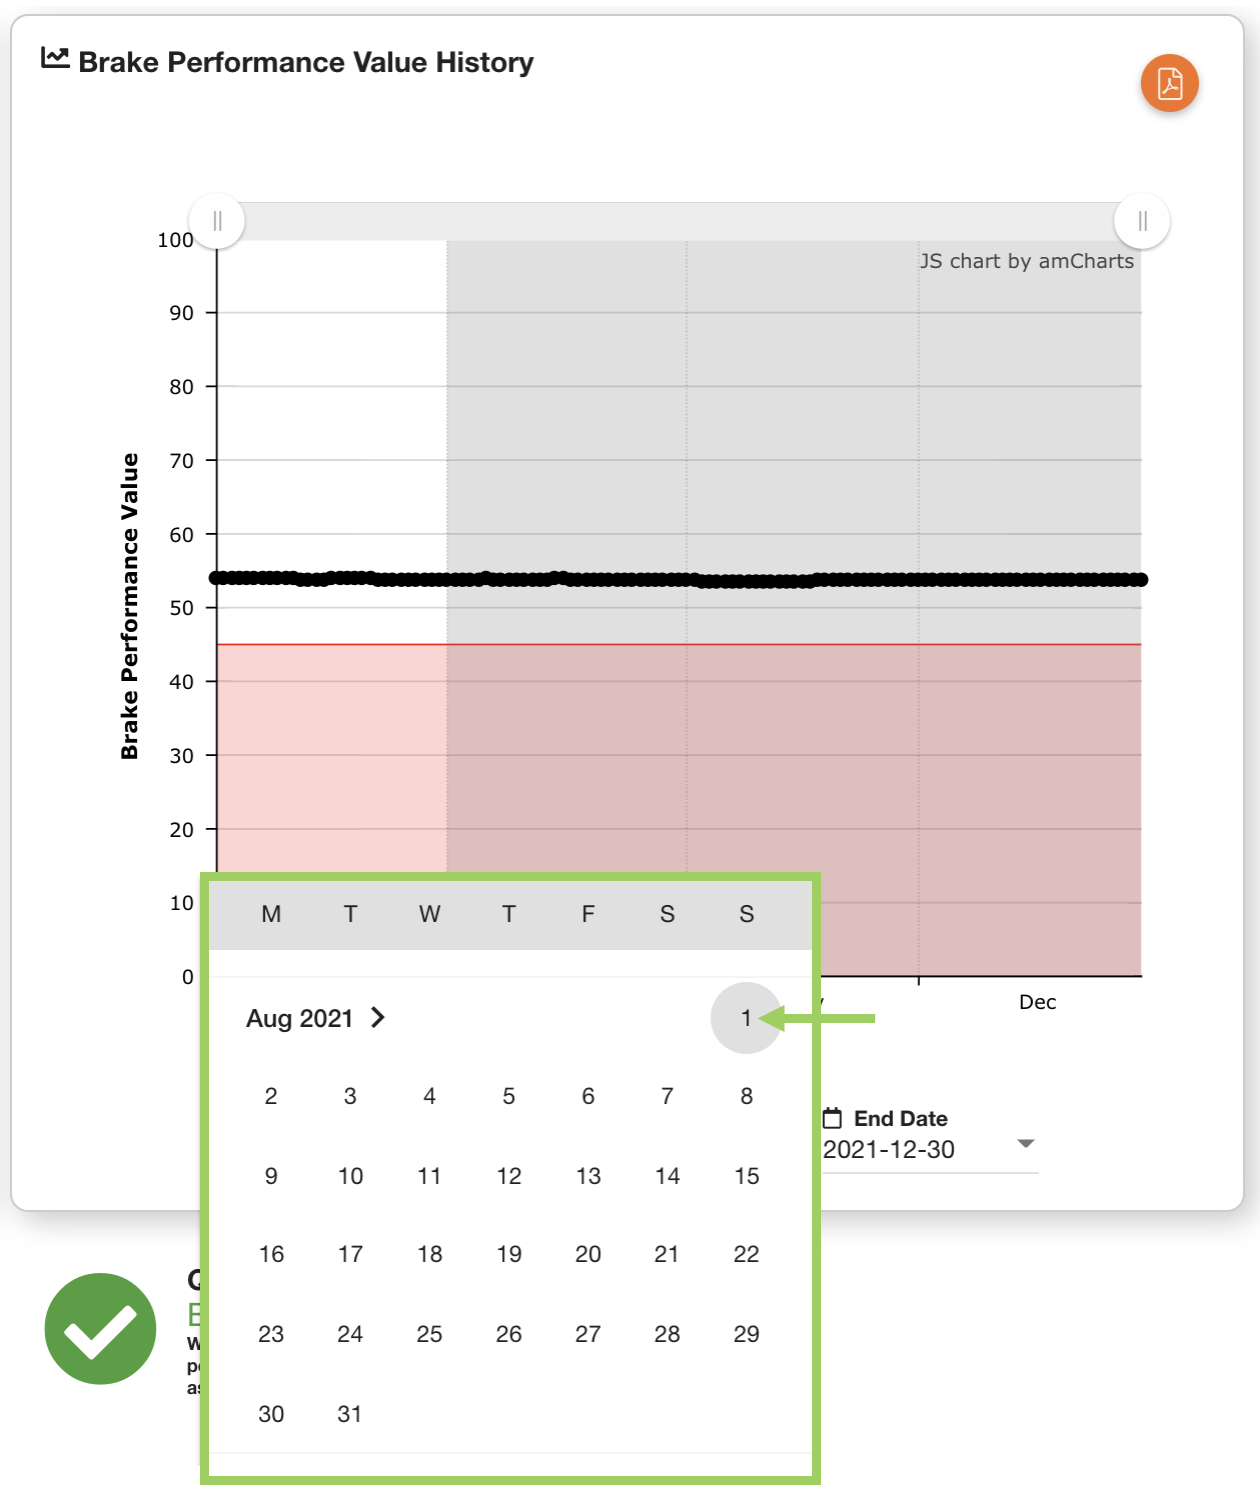
Changing Date Range
You can change the date range plotted on the graph by using the date-pickers below the graph to change the start and/or the end date.
|  |
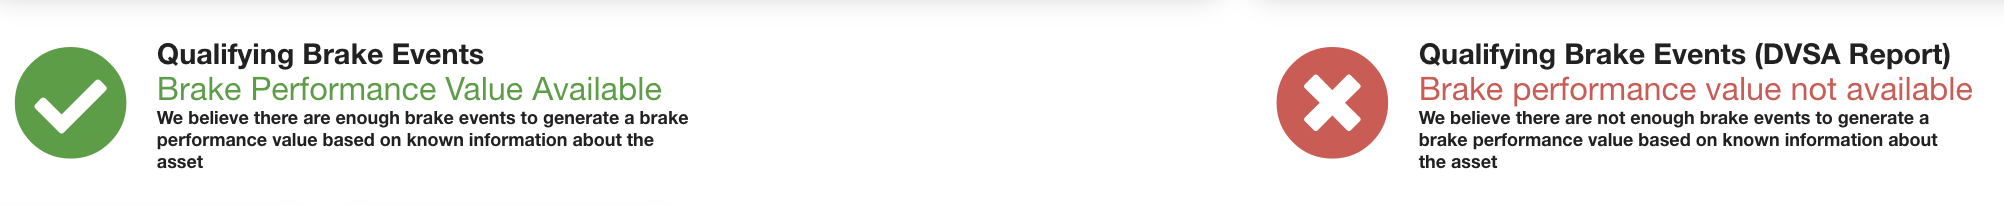
Qualifying Brake Events
Below the summary and graph sections are icons to quickly show whether there is enough qualifying data to produce a brake performance value and to generate a DVSA report. The icons will either have a green tick ![]() or a red cross
or a red cross ![]() .
.
Green ticks for both mean the asset has been driven enough and produced enough brake events to calculate an accurate Brake Performance Value, and a DVSA report can be generated.

A red cross for ‘Qualifying Brake Events’ means the asset does not have enough data to produce an accurate Brake Performance Value.
A red cross for ‘Qualifying Brake Events (DVSA Report)’ means the asset does not have enough data to produce a DVSA report - this may occur when a DVSA report has just been generated or a service date has been added. Data before a brake service or dates included in a previous DVSA report will not be included in your next report, so you will have to wait a period of time to have enough data to produce another report.
The primary resolution is to use the asset and produce more data or to wait for a period of time for more data to become available during the asset’s normal use.
Brakes Serviced
The ‘Braves Serviced' option on the EBPMS section allows you to inform the system of a change in performance in the asset’s brakes. This is important for generating reports as the brake scores recorded before the service took place are now no longer relevant, and may skew the brake performance report negatively. Therefore the Brake Service will become an intersect in the data, and only brake scores after the event will be used to calculate the brake scores and generate the next report.
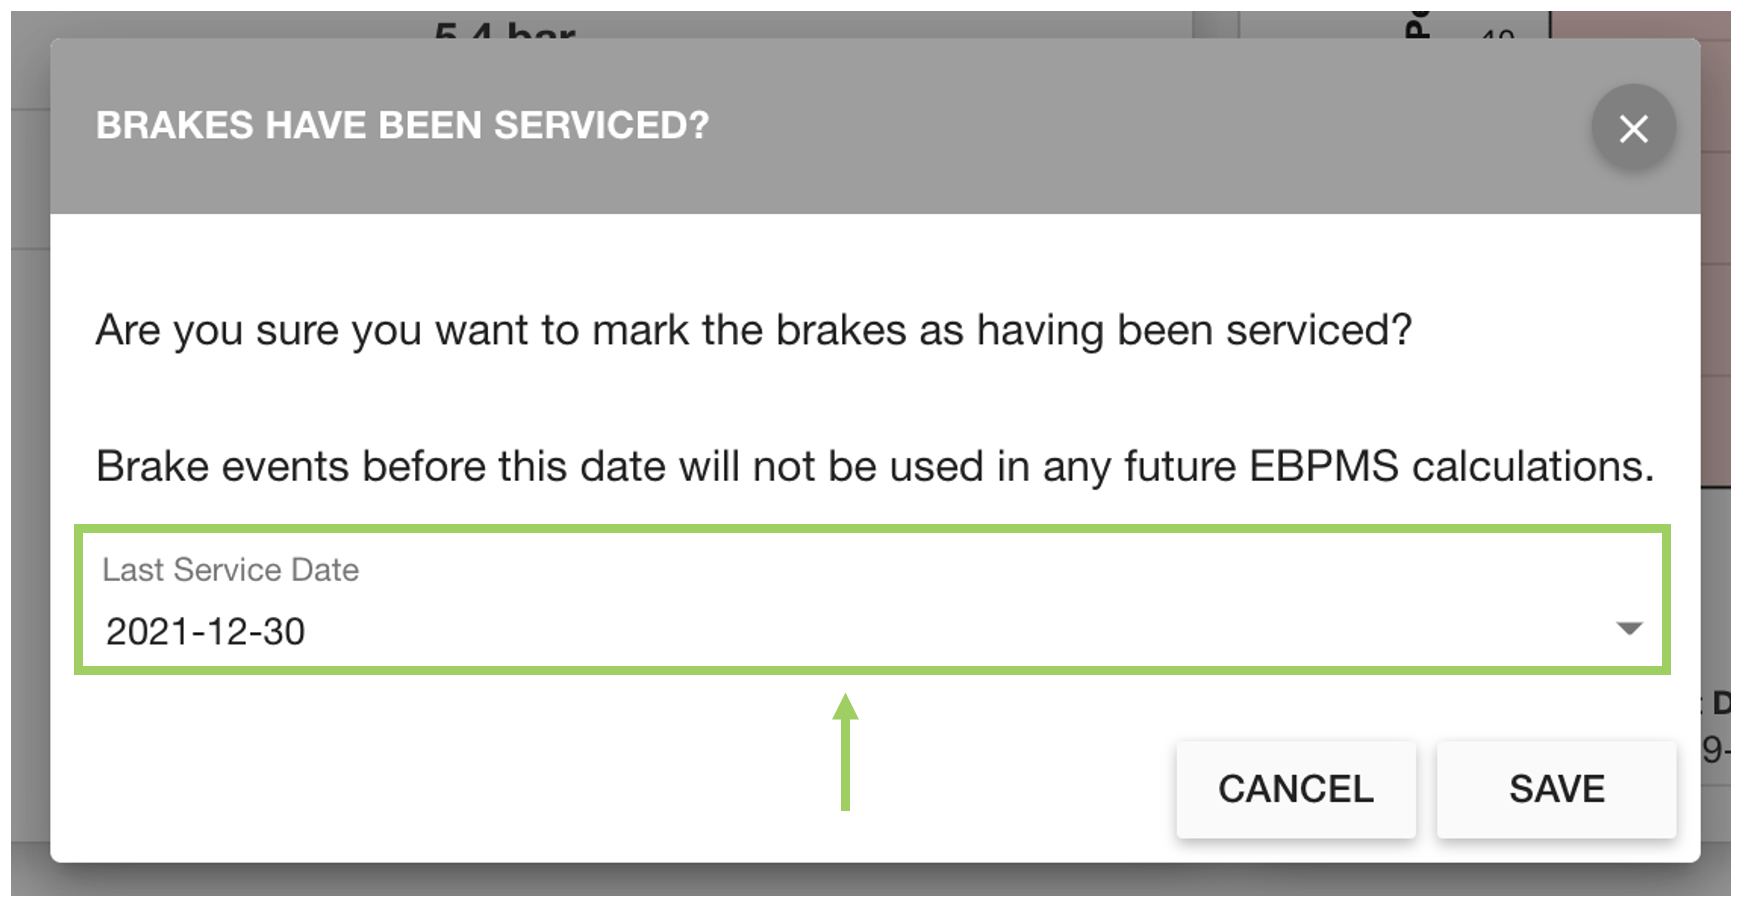
To add a brake service date to an asset, click on the ‘Brakes Serviced’ button. | 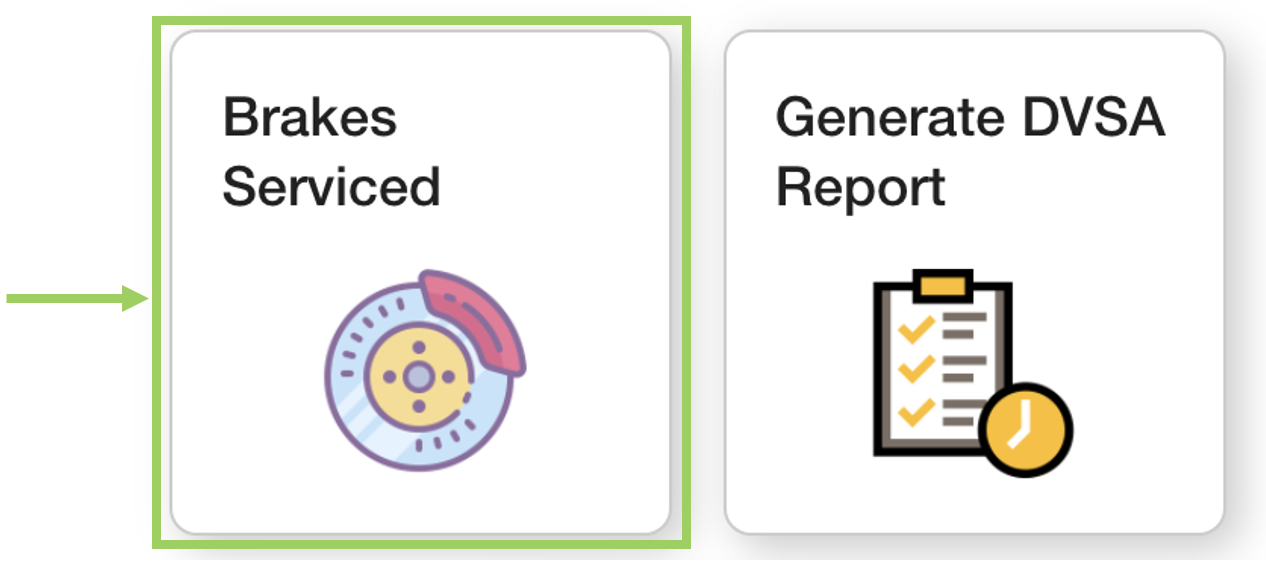 |
This will open the dialog box with a field containing the date of the service. Click on the default date (current date) to change the date of the service. This will open a calendar date-picker.
Use the date-picker to select the service date for the asset. | 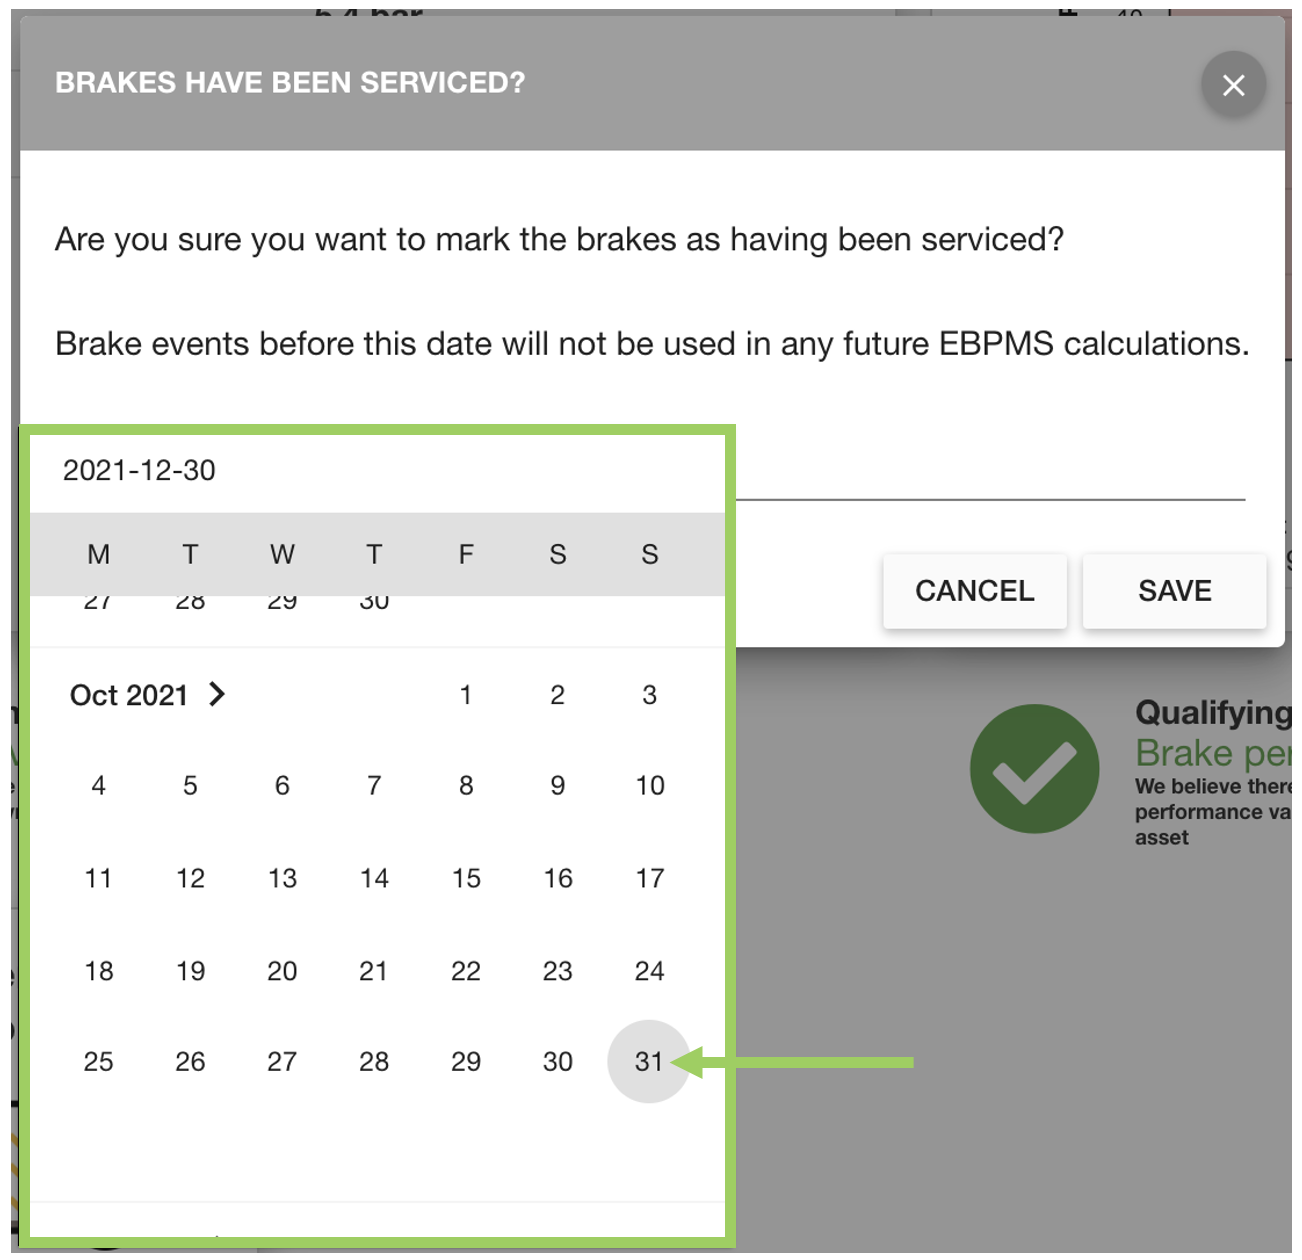 |
Once the relevant date is showing in the field, click the ‘Save’ button.
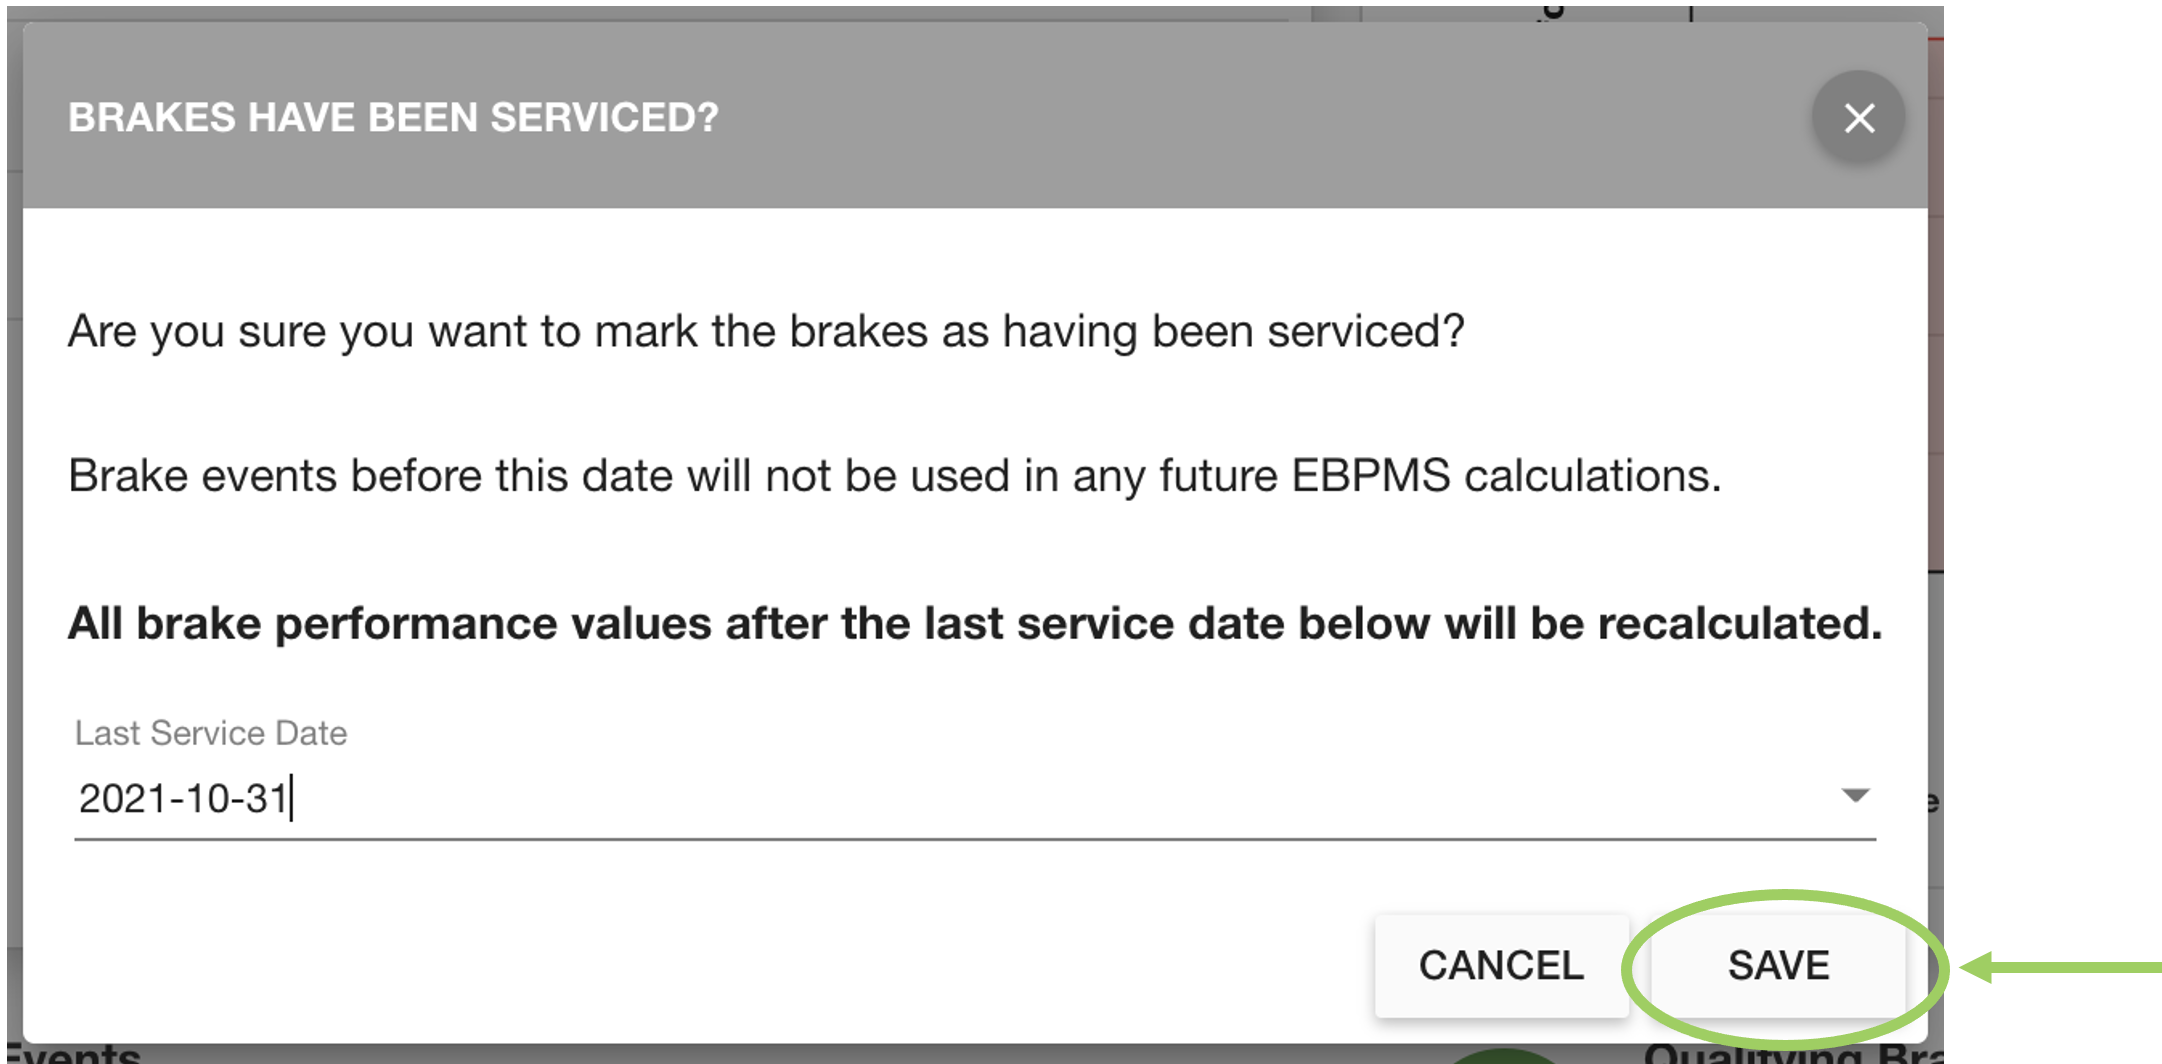
The date entered here will ensure brake scores before this date are excluded from brake scores and reports, and brake performance values after the last service date below will be recalculated.
You may not have enough brake events to generate a DVSA report now, as events earlier than the service date are excluded.
You will also see the service date reflected on the graph as a division. Any data before the divider will not be used for reports and brake performance values after this date will be recalculated. | 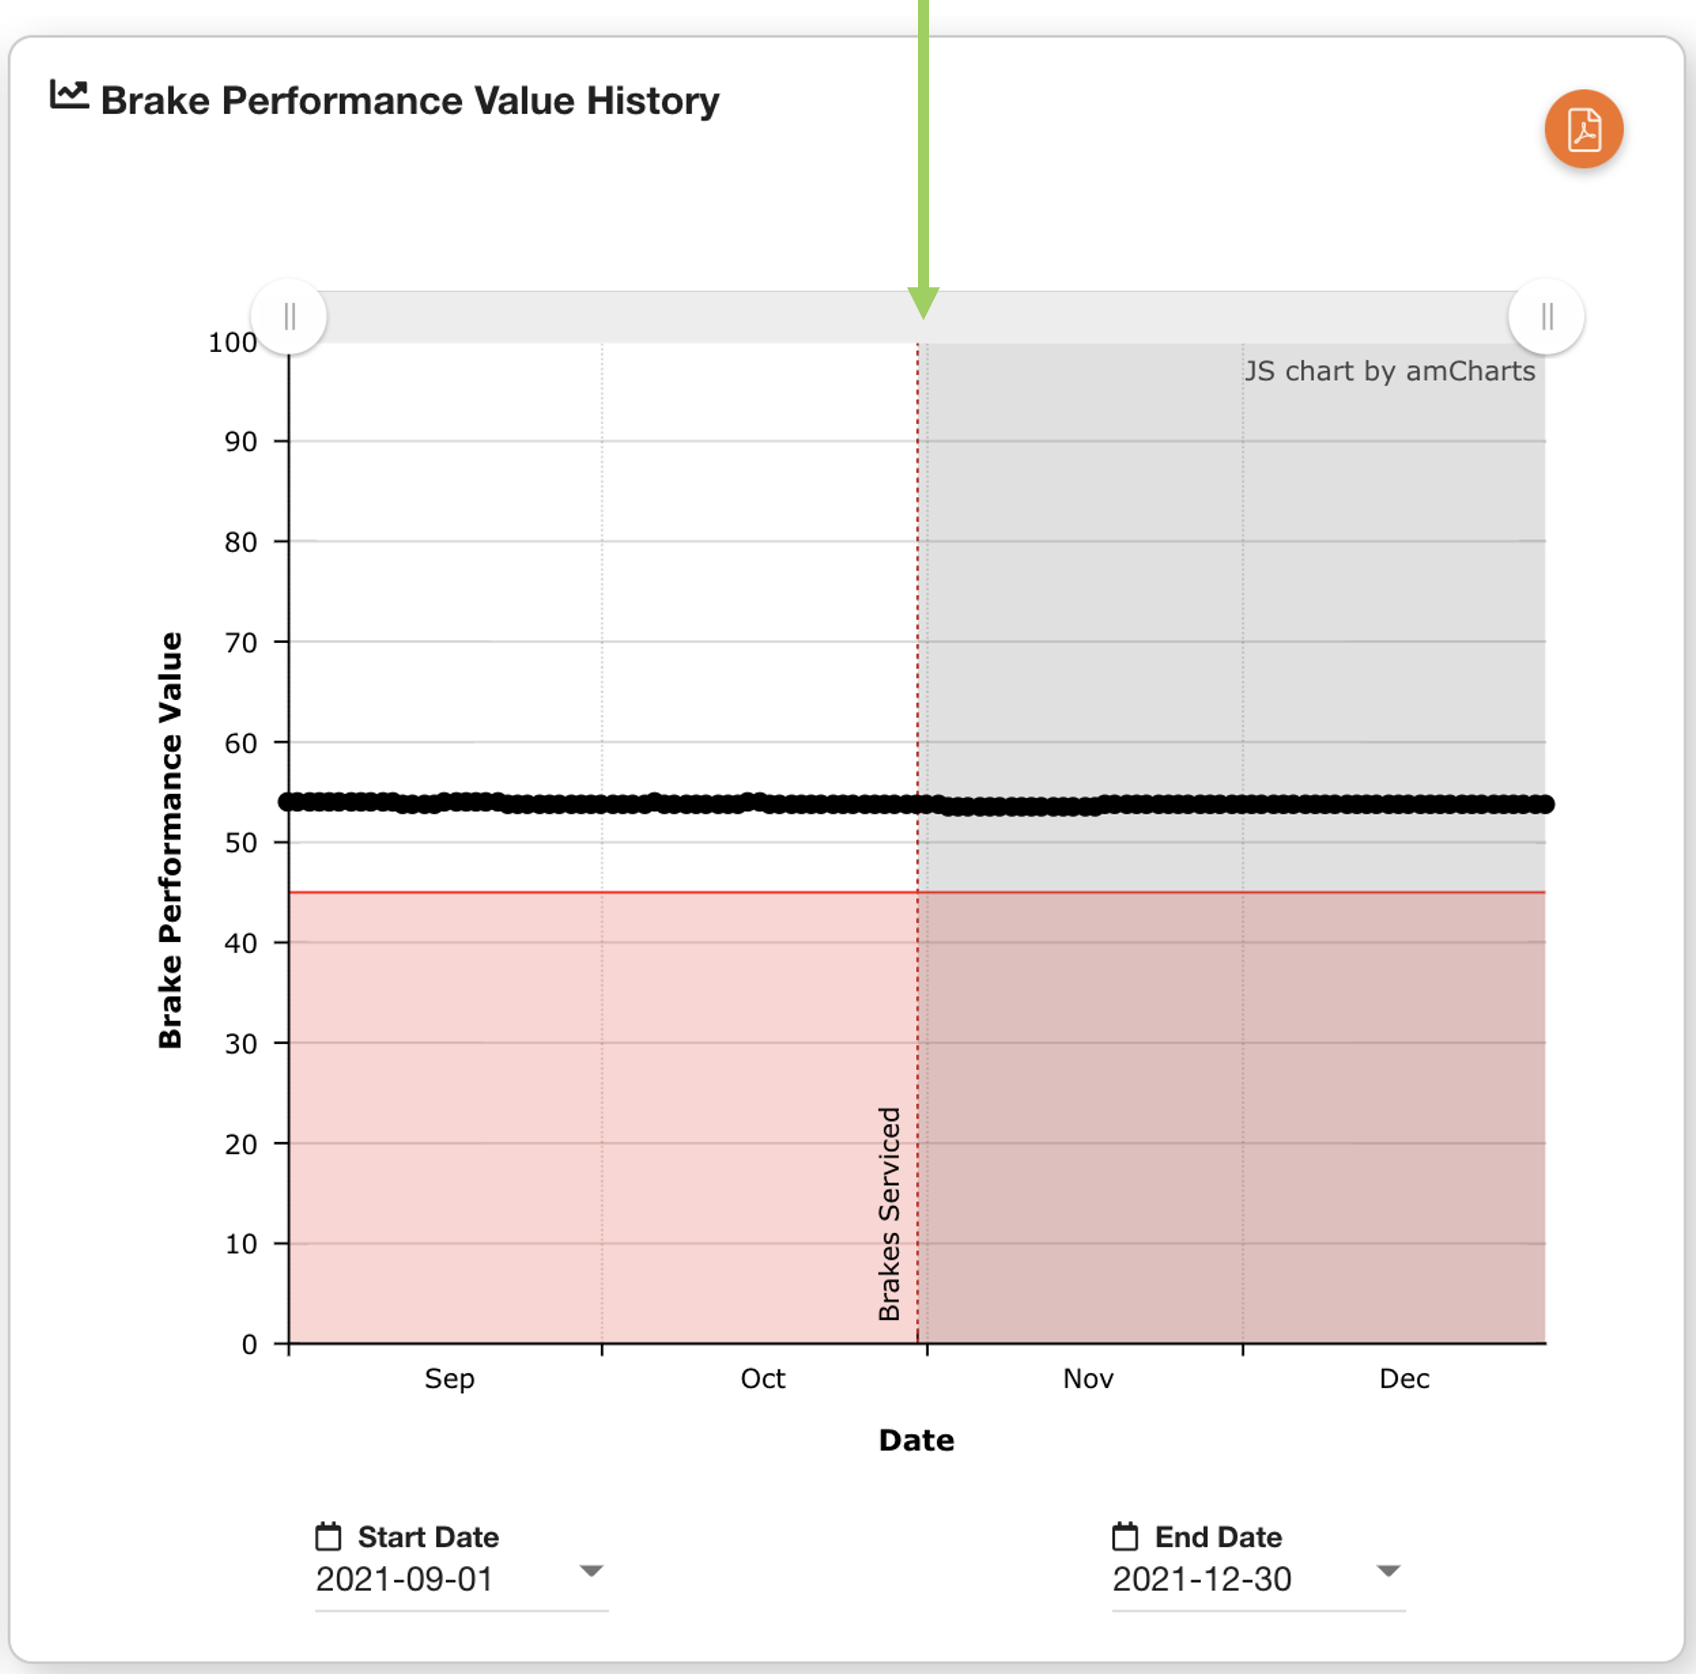 |
Generating Reports
Reports can be used to provide support for safety inspections on your assets.
Other users in your company can see you have generated the DVSA report.
To create a DVSA report for an asset, click on the ‘Generate DVSA Report’ button. | 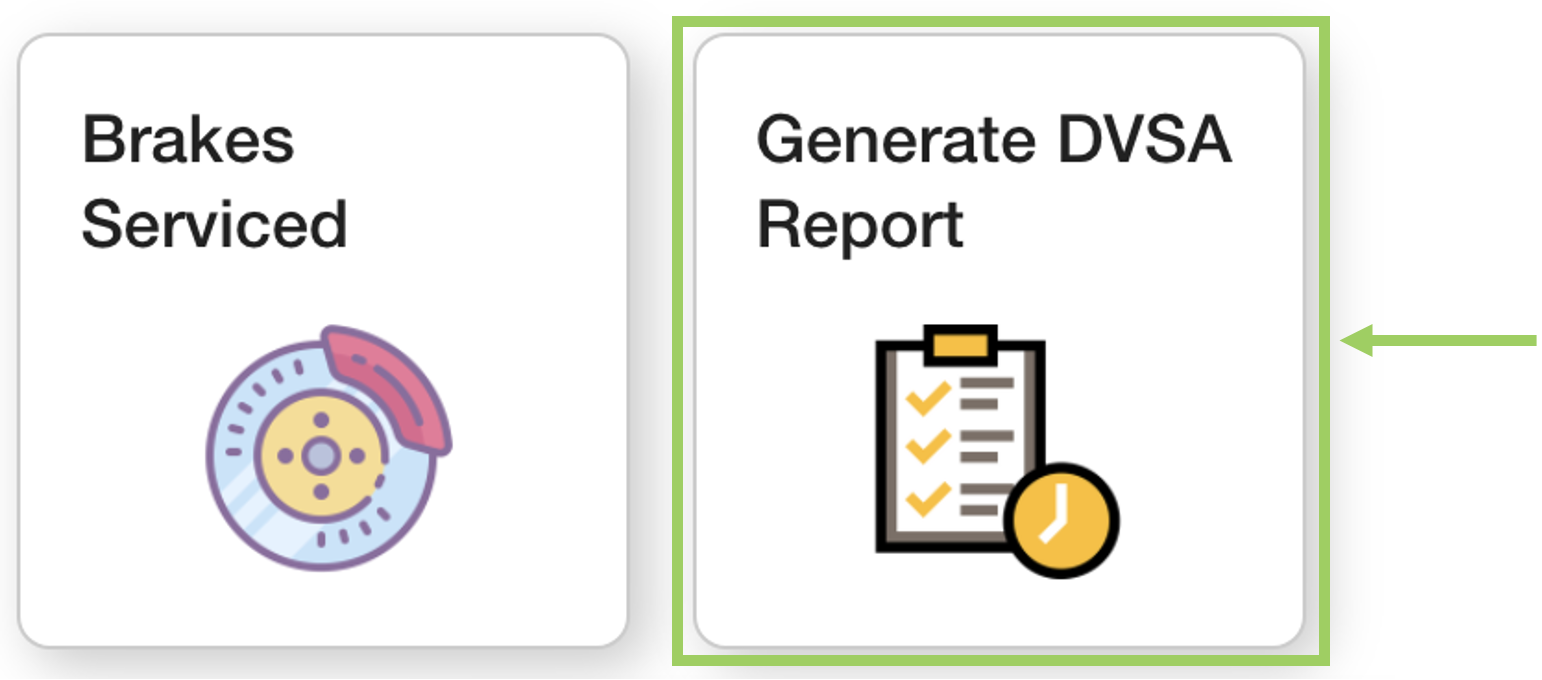 |
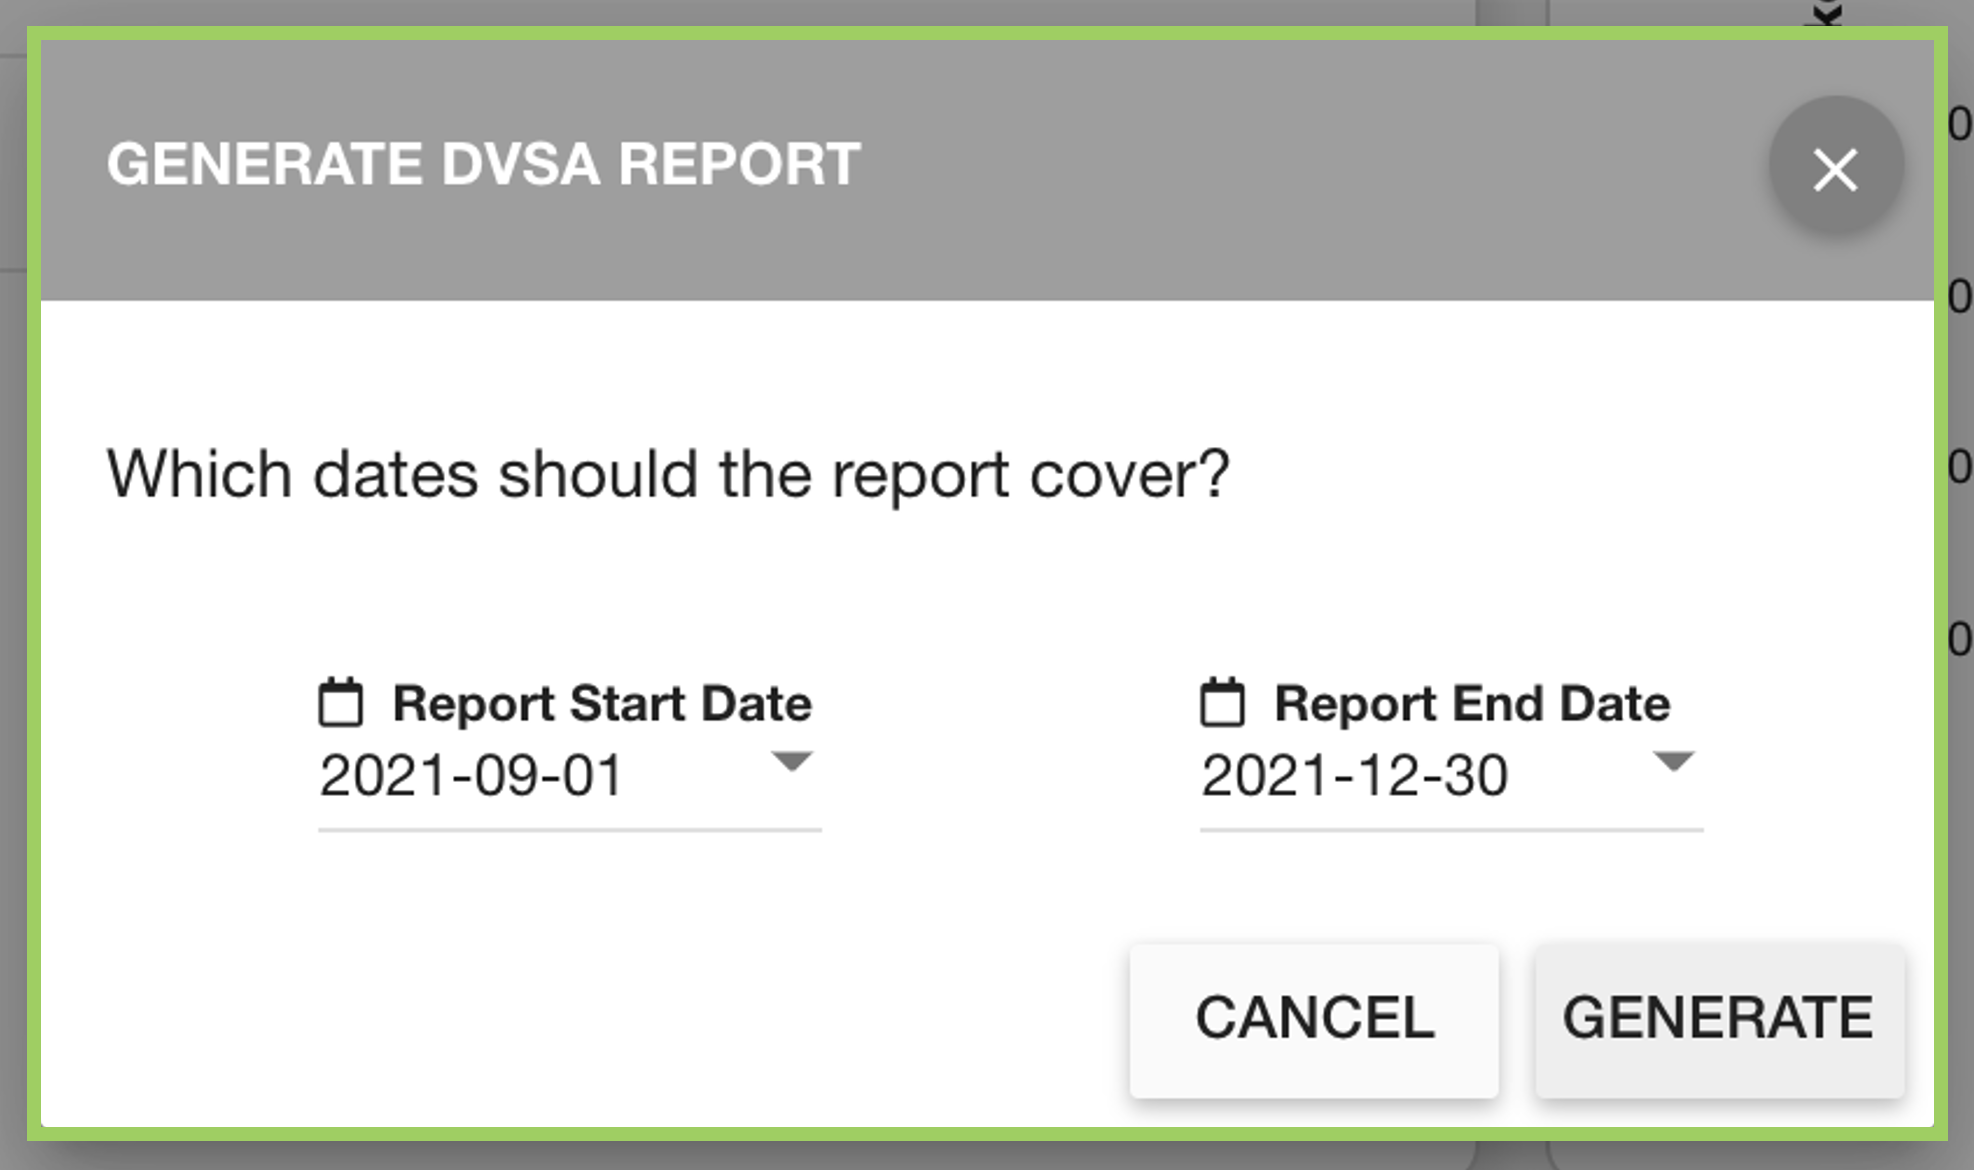
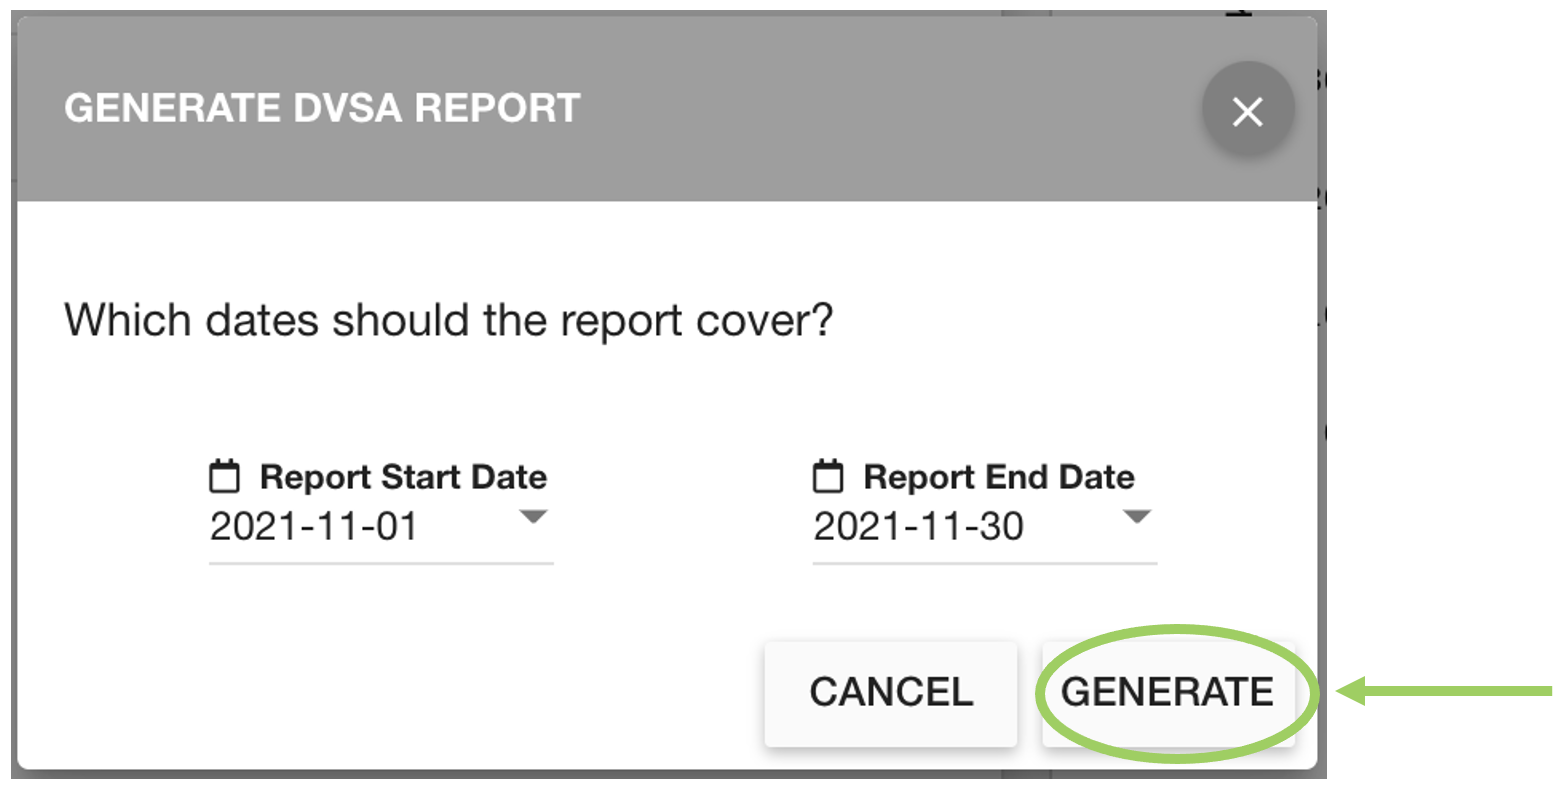
This will open the report dialog with fields for the dates you want the report to cover.
The default start and end date match the date range of the graph.
If you click the ‘Generate DVSA Report’ button and see this dialog
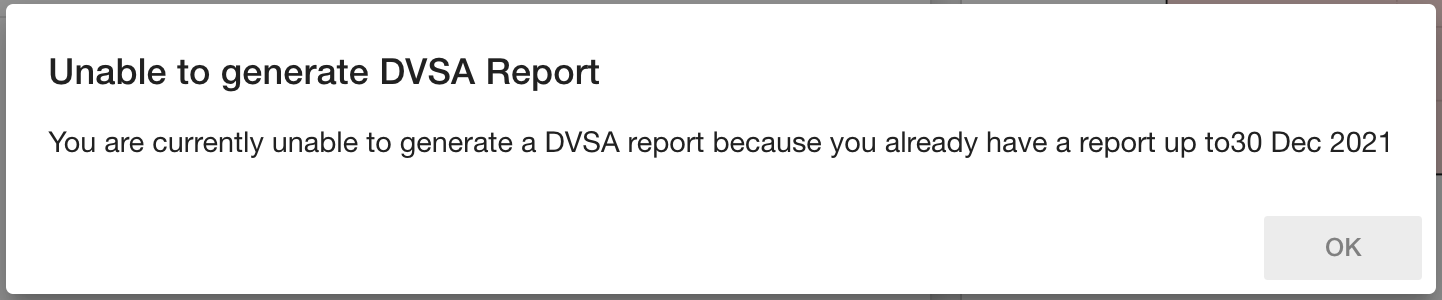
This likely means you do not have enough qualifying brake events to be able to generate a DVSA report yet, either because a DVSA report has been recently generated or the asset has not been used enough recently.

To change the dates, click on a date field to open the calendar date-picker. Using this, click on the relevant date. | 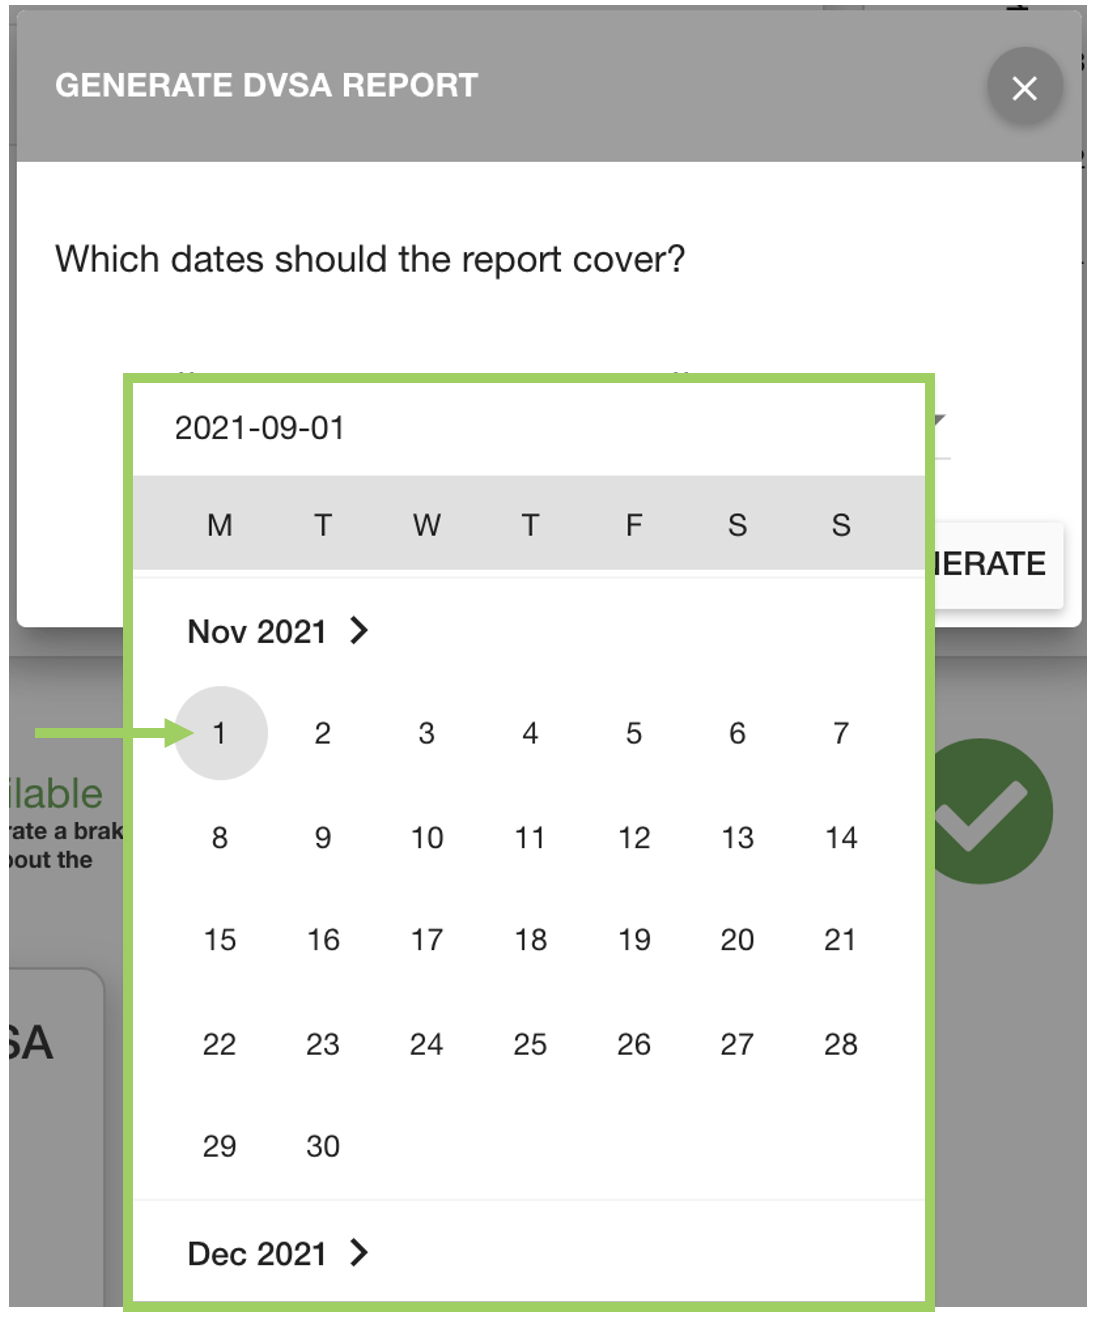 |
Once the appropriate dates are showing in the fields, click the ‘Generate’ button.
You will see the DVSA Report Date reflected on the graph as a division. Any data before the divider will not be used for future reports. | 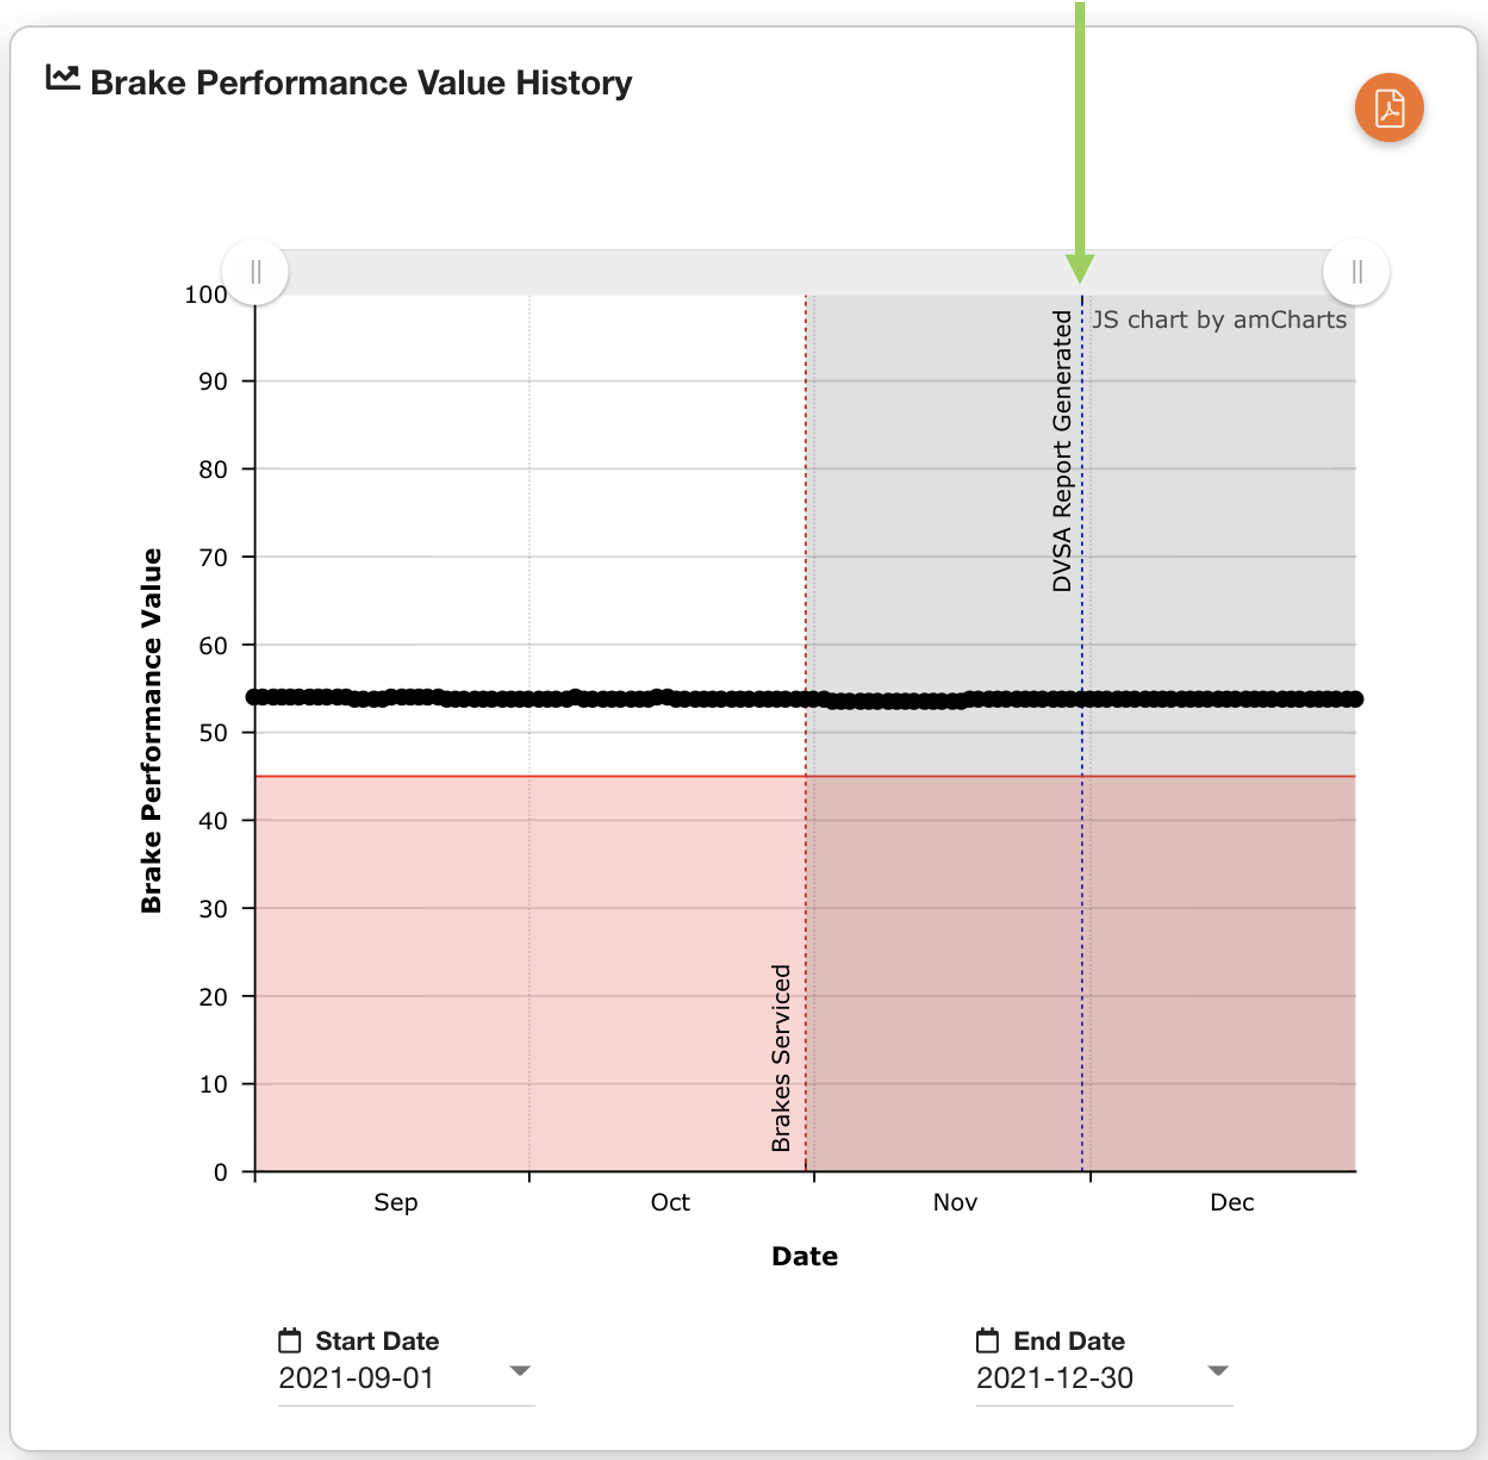 |
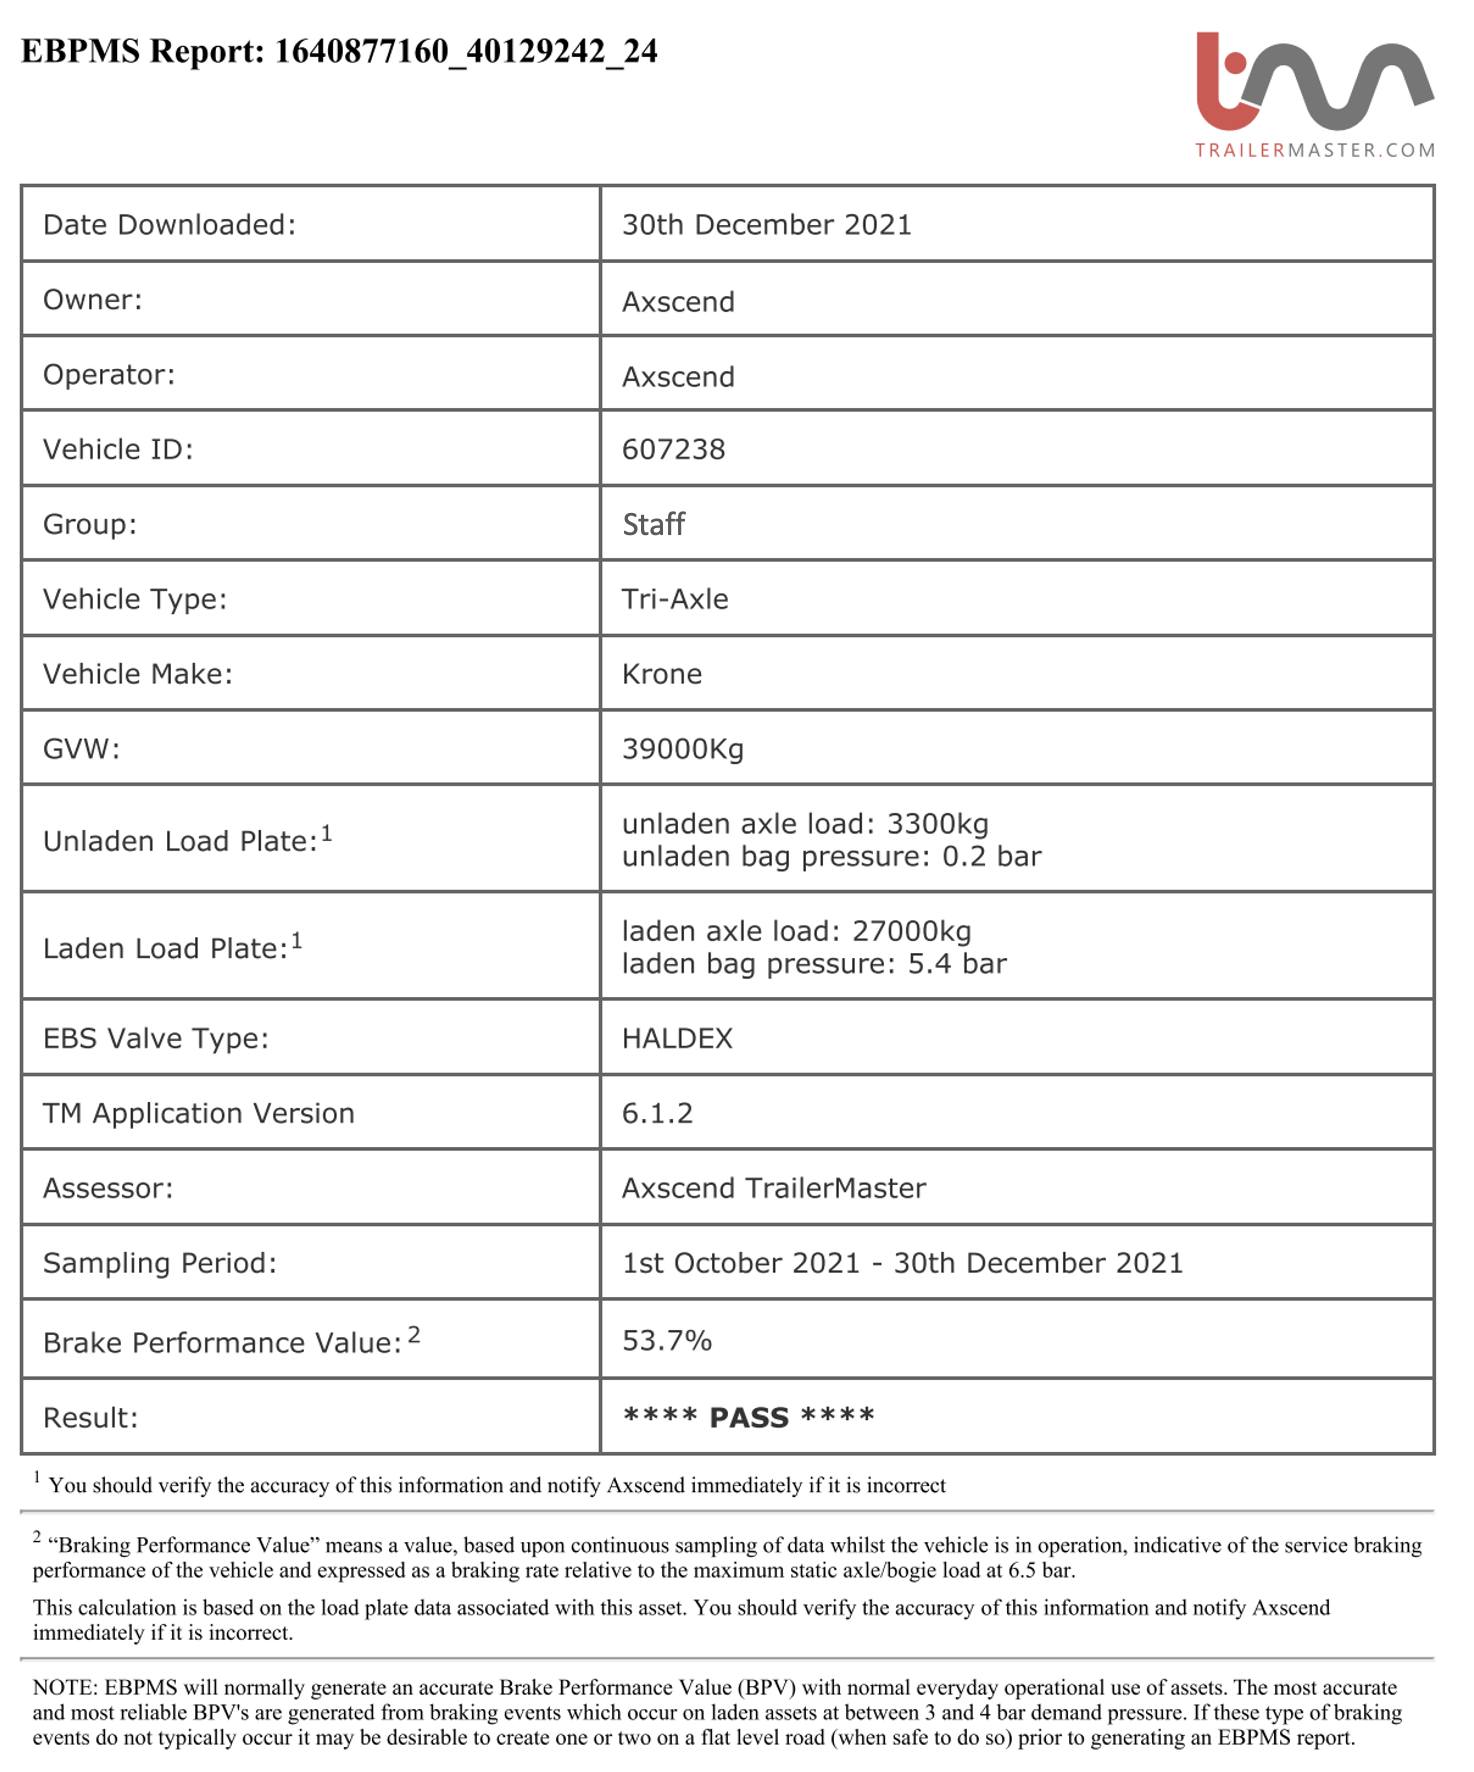
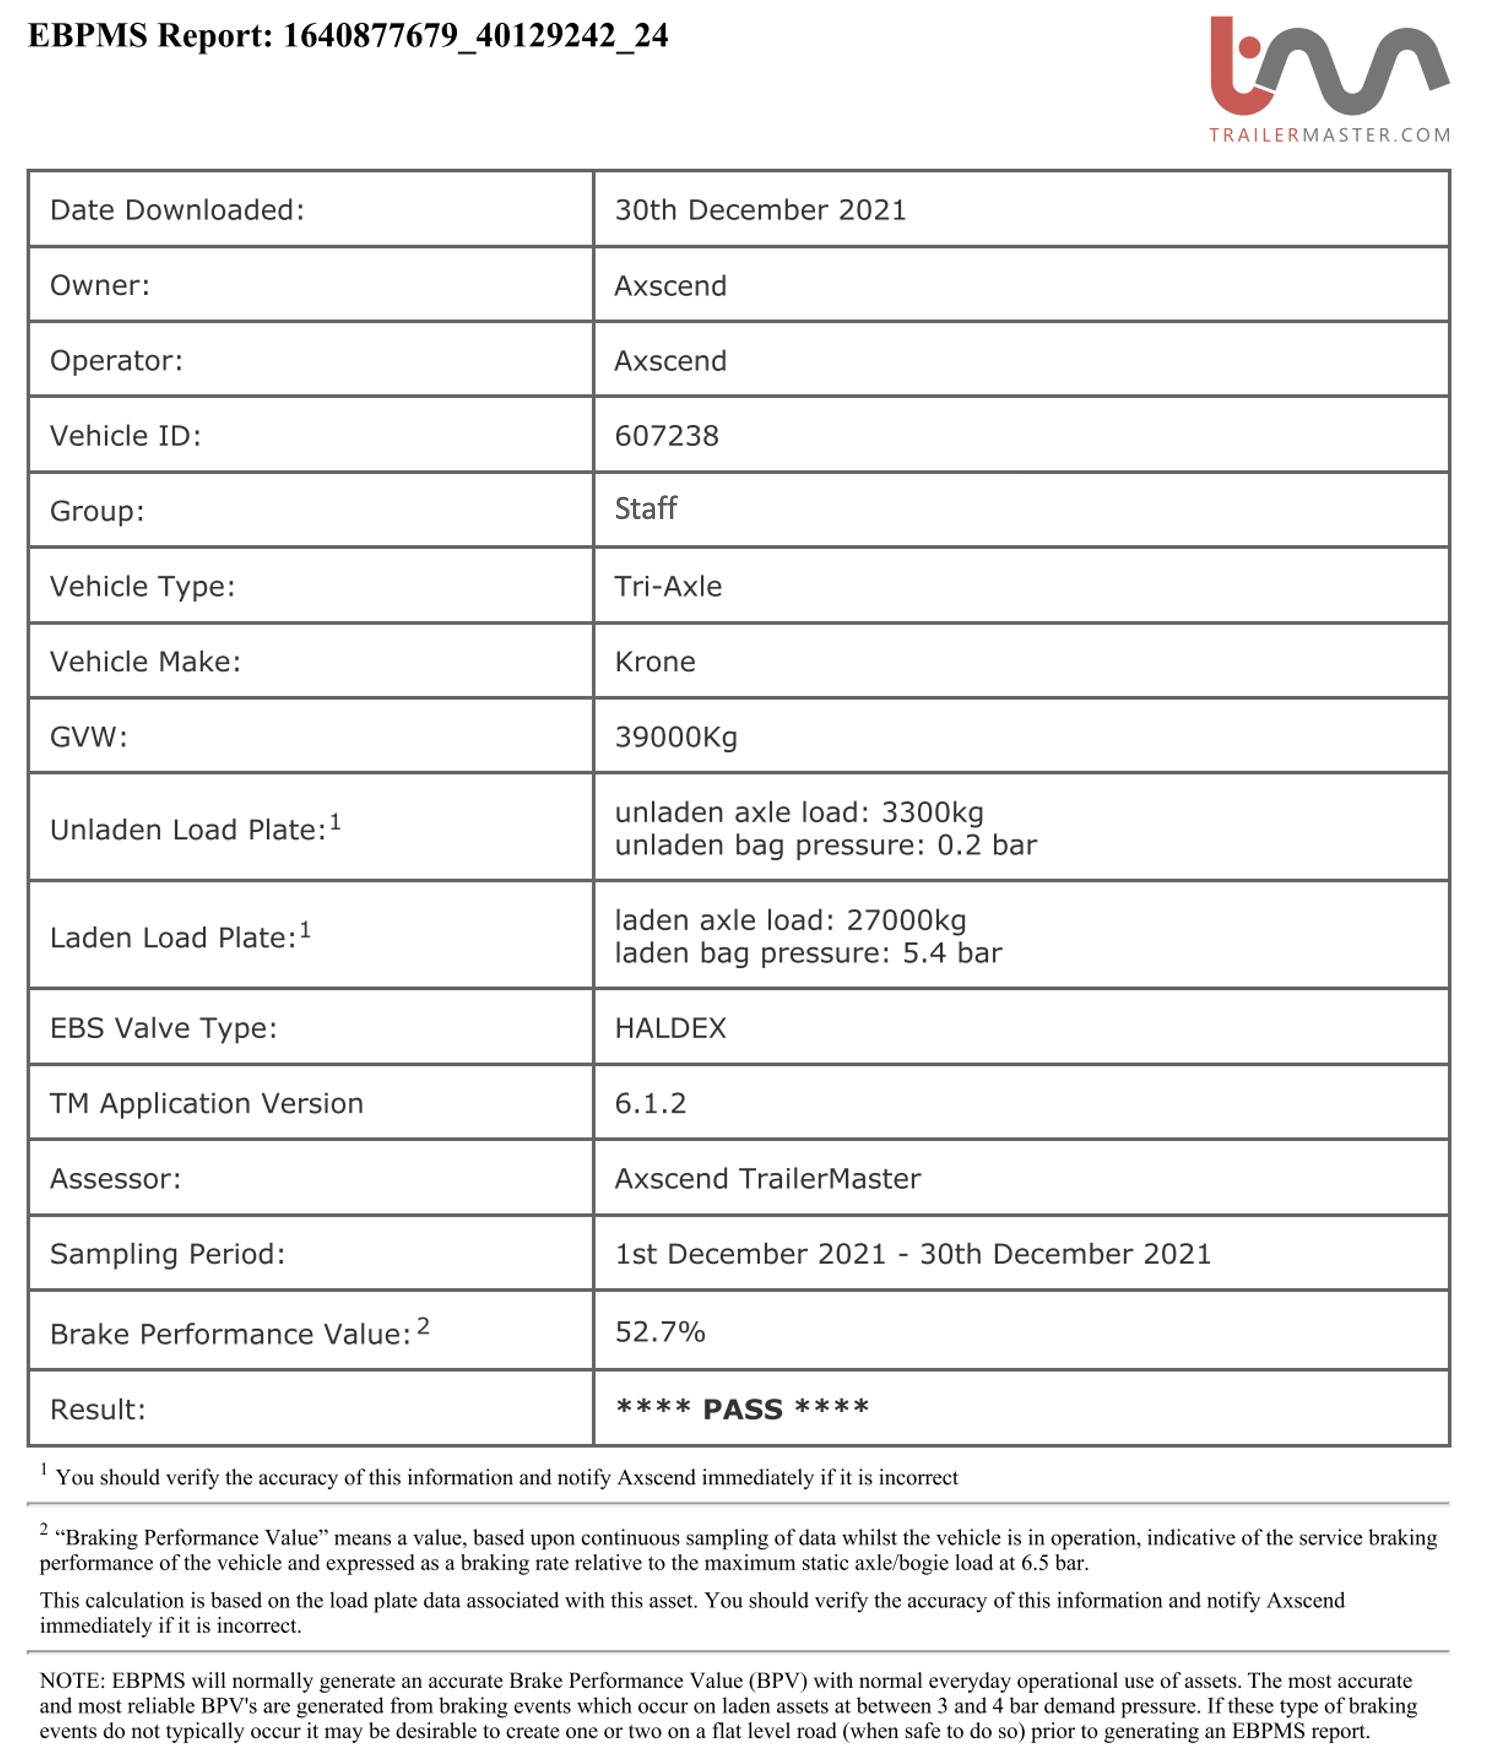
Downloading Reports
You are also able to view the daily reports or see all previous DVSA reports generated for an asset.
Daily reports are daily snapshots that show the Brake Performance Value generated each day based on the range (default of 56 days, but can be specified by company) of data. DVSA reports are created by the date specified when the report was generated.
To see the list of reports available for download, click the ‘PDF’ icon on the graph section. | 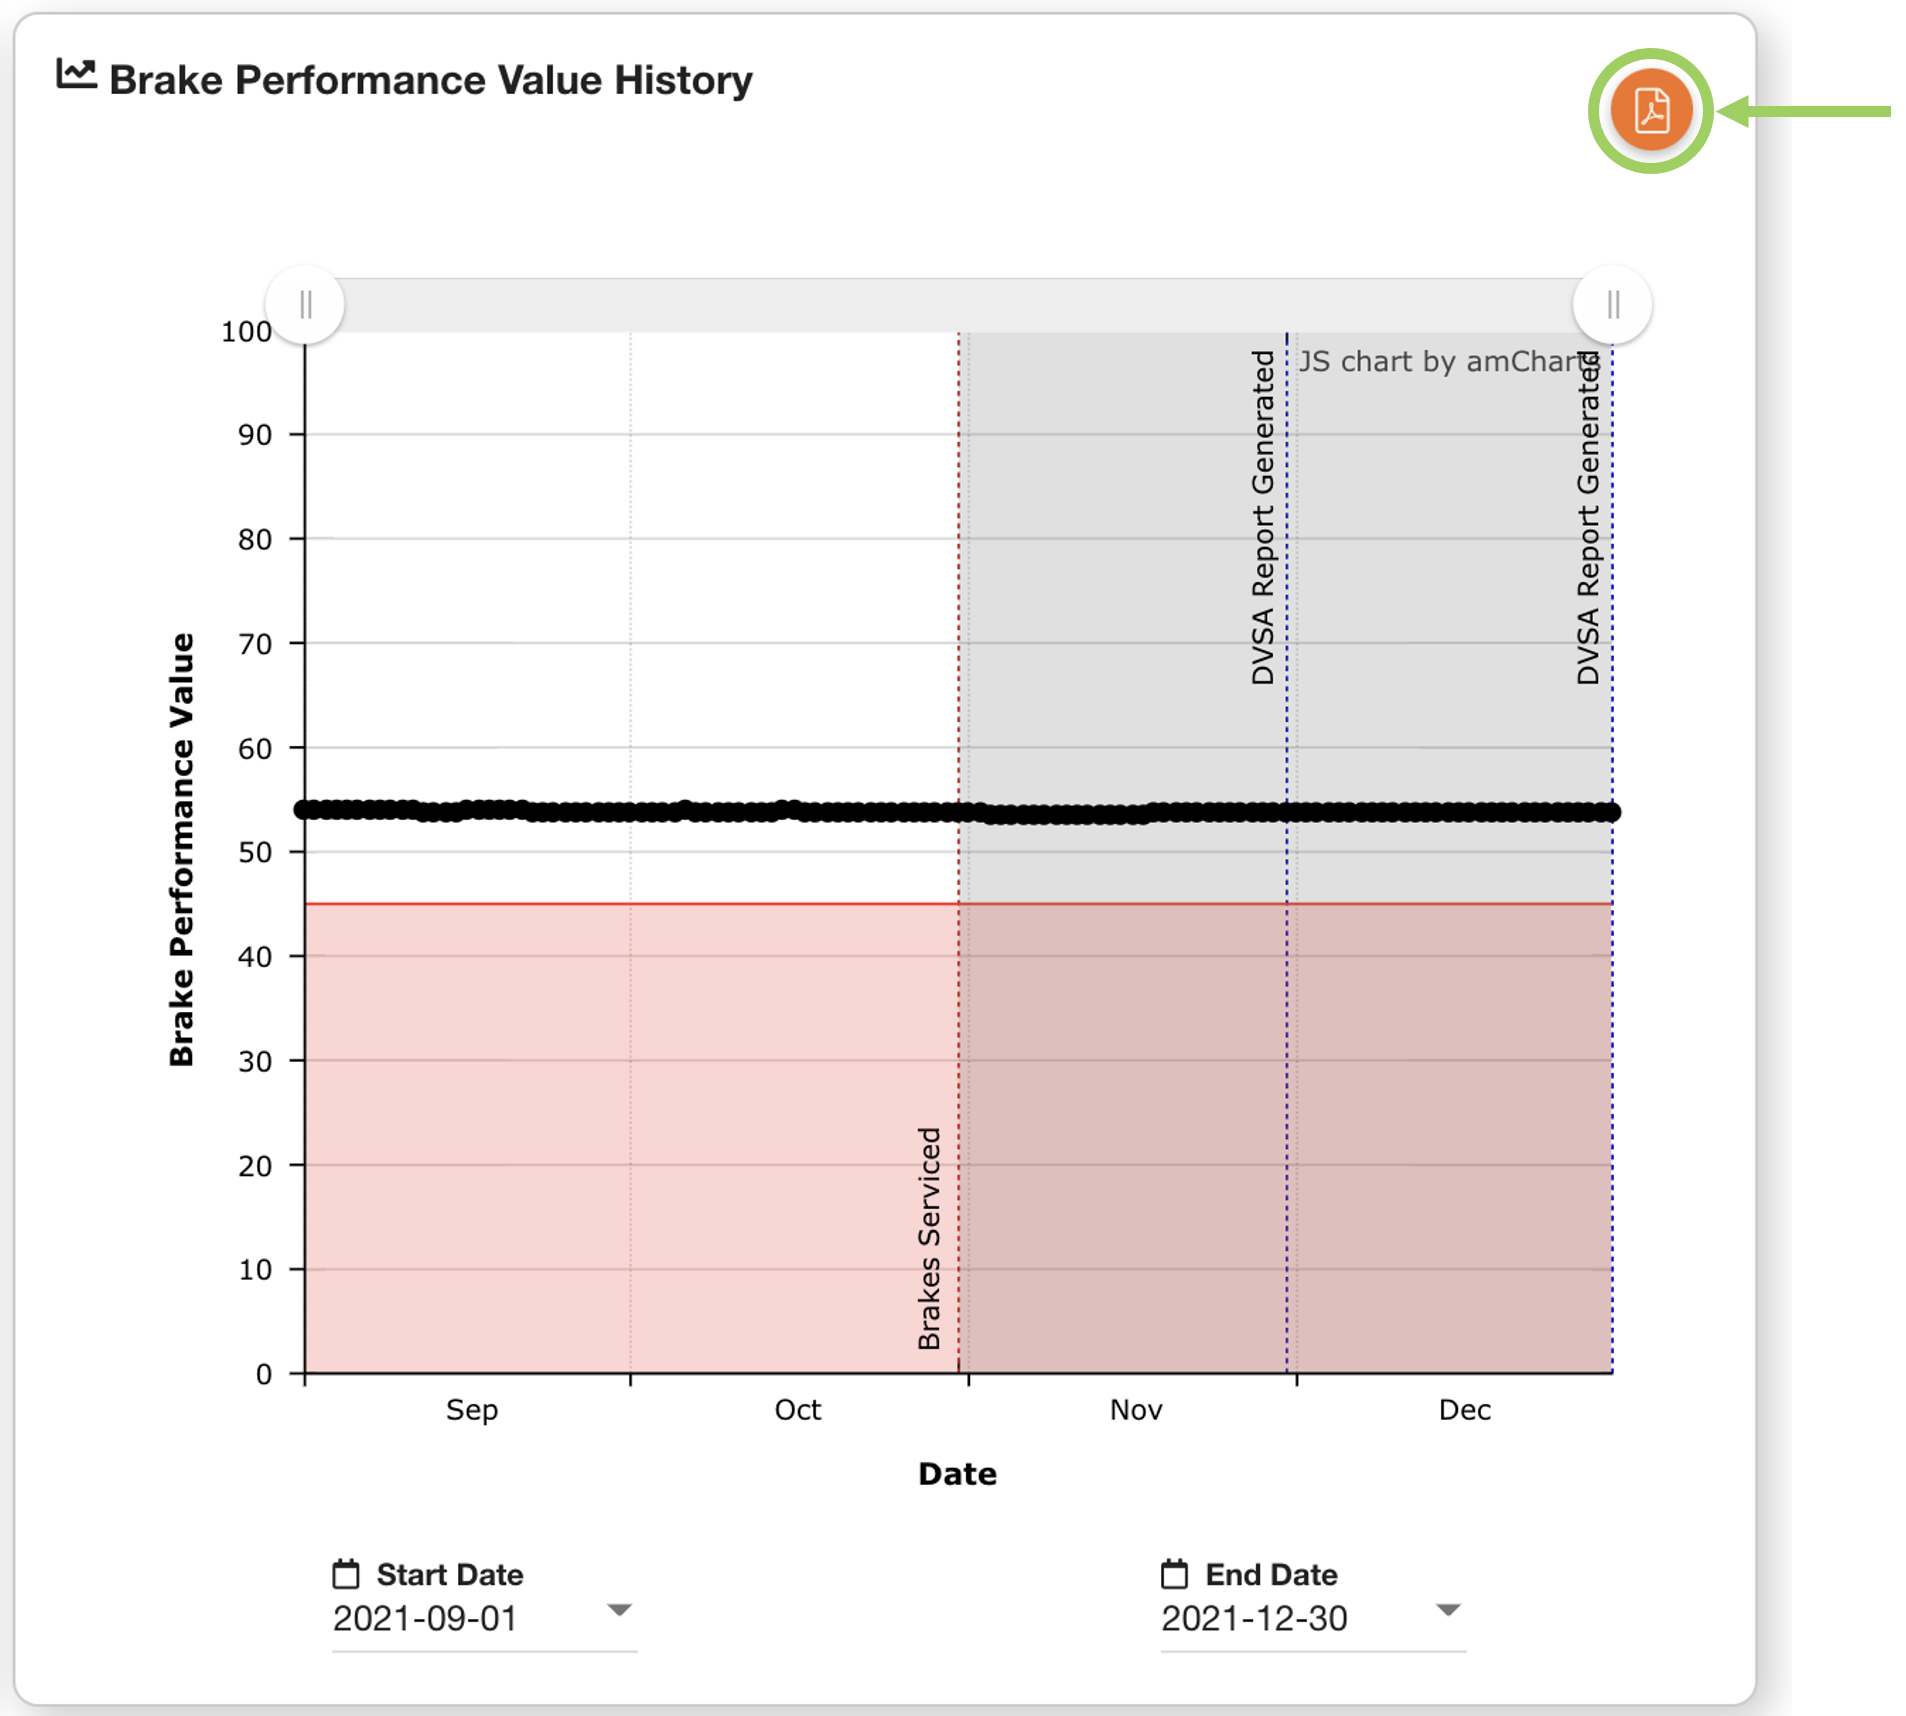 |
This will open a dialog box with a list of reports available. On the left side is daily Brake Performance Value reports; on the right side are DVSA reports, along with the user which generated the report.
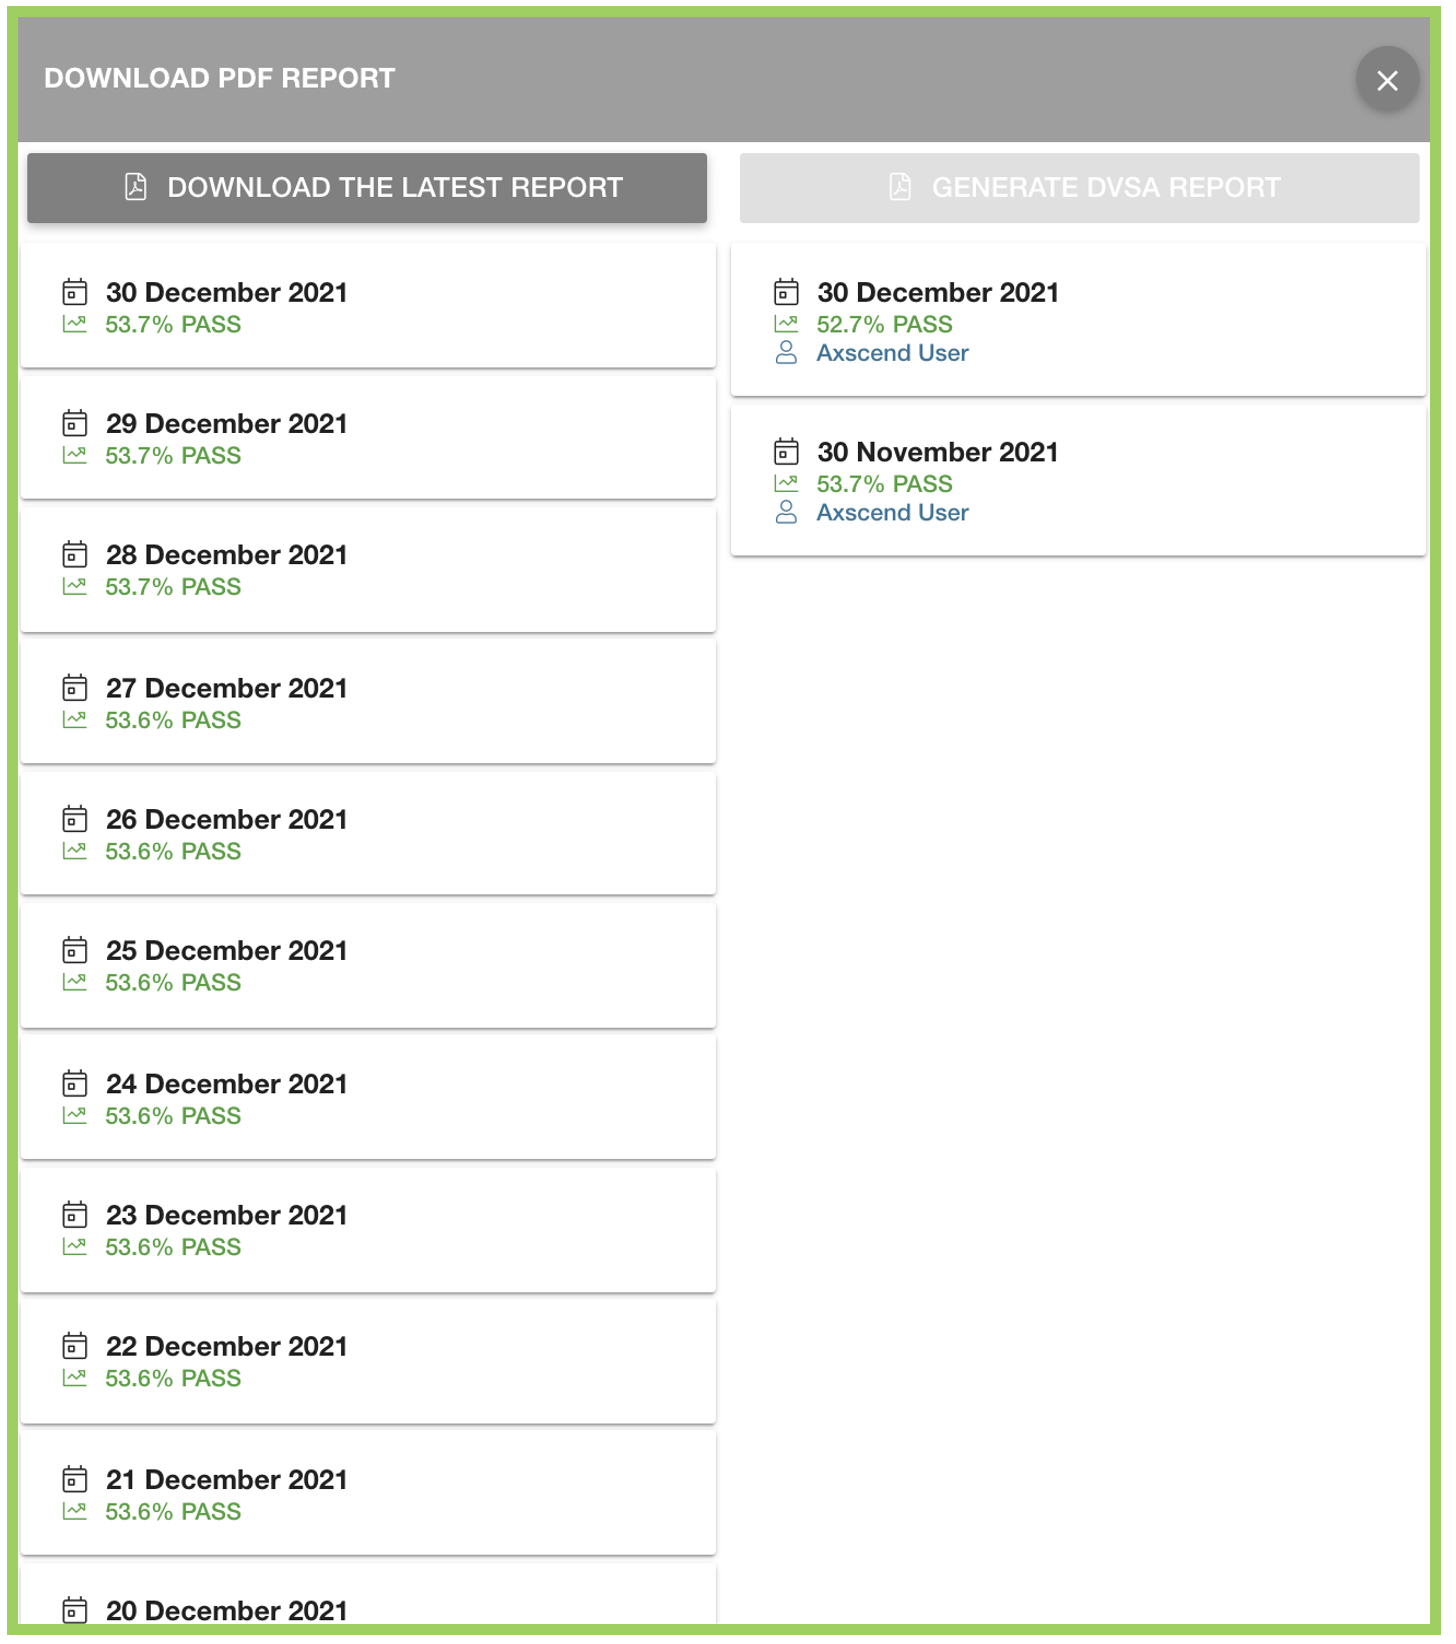
Click on any report in the list to download a copy of the report. Alternatively, use the ‘Download The Latest Report’ button to download the most recent from the list.
 Troubleshooting
For any issues or errors that have not been solved please Contact Axscend Support.