.png)
Go to the Analysis page to see how to get here
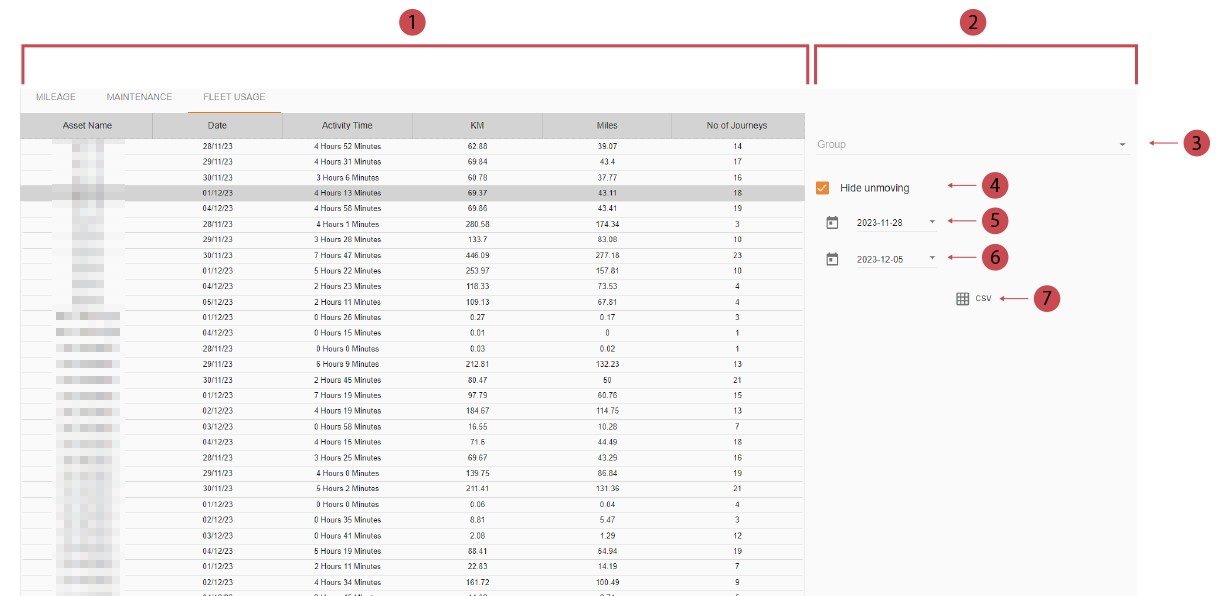
You’re on the Analysis page.
You’re in the Fleet Usage tab.
The Fleet Usage analysis breaks down the activities of an asset each day. The Fleet Usage analysis page is sectioned into the main breakdown table, and to the right, various controls to change the data displayed on the table.
|
No. |
Description |
|---|---|

|
Breakdown The breakdown shows you how many trips an asset has made and how many kilometres/miles it has travelled over the chosen time period.
|

|
Controls You can use the controls on the right to:
|

|
Group and Company To only show records from a specific group click into the Group field. Company Filter If you are mapped to more than one company you may also have a Company filter option which works in the same way as the Group filter. |

|
Hide Unmoving You can show assets with no activity by unticking the ‘Hide Unmoving’ checkbox. |

|
Start Date Click into the start date field and click on a day from the calendar to select a start date. You can also scroll up or down the calendar to skip through the months. The different styles of circles on the calendar:
|

|
End Date Click into the end date field and click on a day from the calendar to select an end date. You can also scroll up or down the calendar to skip through the months. The different styles of circles on the calendar:
|

|
Download CSV You can download a snapshot of the Fleet Usage table as a CSV report, which will include all the table headings as columns in the CSV. To download the CSV report, click on the grid icon in the controls section. The Group and Date filters applied to the table will also be applied to the report, however, the ‘Hide Unmoving’ checkbox won’t have an effect on the report. You’re on the Analysis page. You’re in the Fleet Usage tab.
The Fleet Usage report will be downloaded. |