.png)
EBPMS (Electronic Brake Performance Monitoring System) analyses each qualifying brake event and generates a daily BPV (Brake Performance Value) by looking at a period of brake events. This is defaulted to 91 days (13 wks) but is customisable per company or asset to match the assets service Inspection interval.
See Adjusting Service Interval Weeks for support doing this.
The system is designed to identify patterns and extract meaningful insights from the data. However, it is important for users to understand the key indicators to monitor to keep their fleet safe.
How to Identify Assets with Deteriorating Brakes
An asset with a high overall score can still have declining brake performance. The BPV offers valuable insight into a vehicle’s braking performance, however, it’s useful to analyse the individual brake events behind the scores in more detail. If this underperformance continues, eventually the BPV will fall below the pass mark, however, looking at the individual events could allow you to catch a deterioration in brake performance earlier.
System Analysis
The system will identify when the last 5 consecutive brake events have underperformed despite an overall good EBPMS score. In these cases, you will see a banner like the one highlighted below.
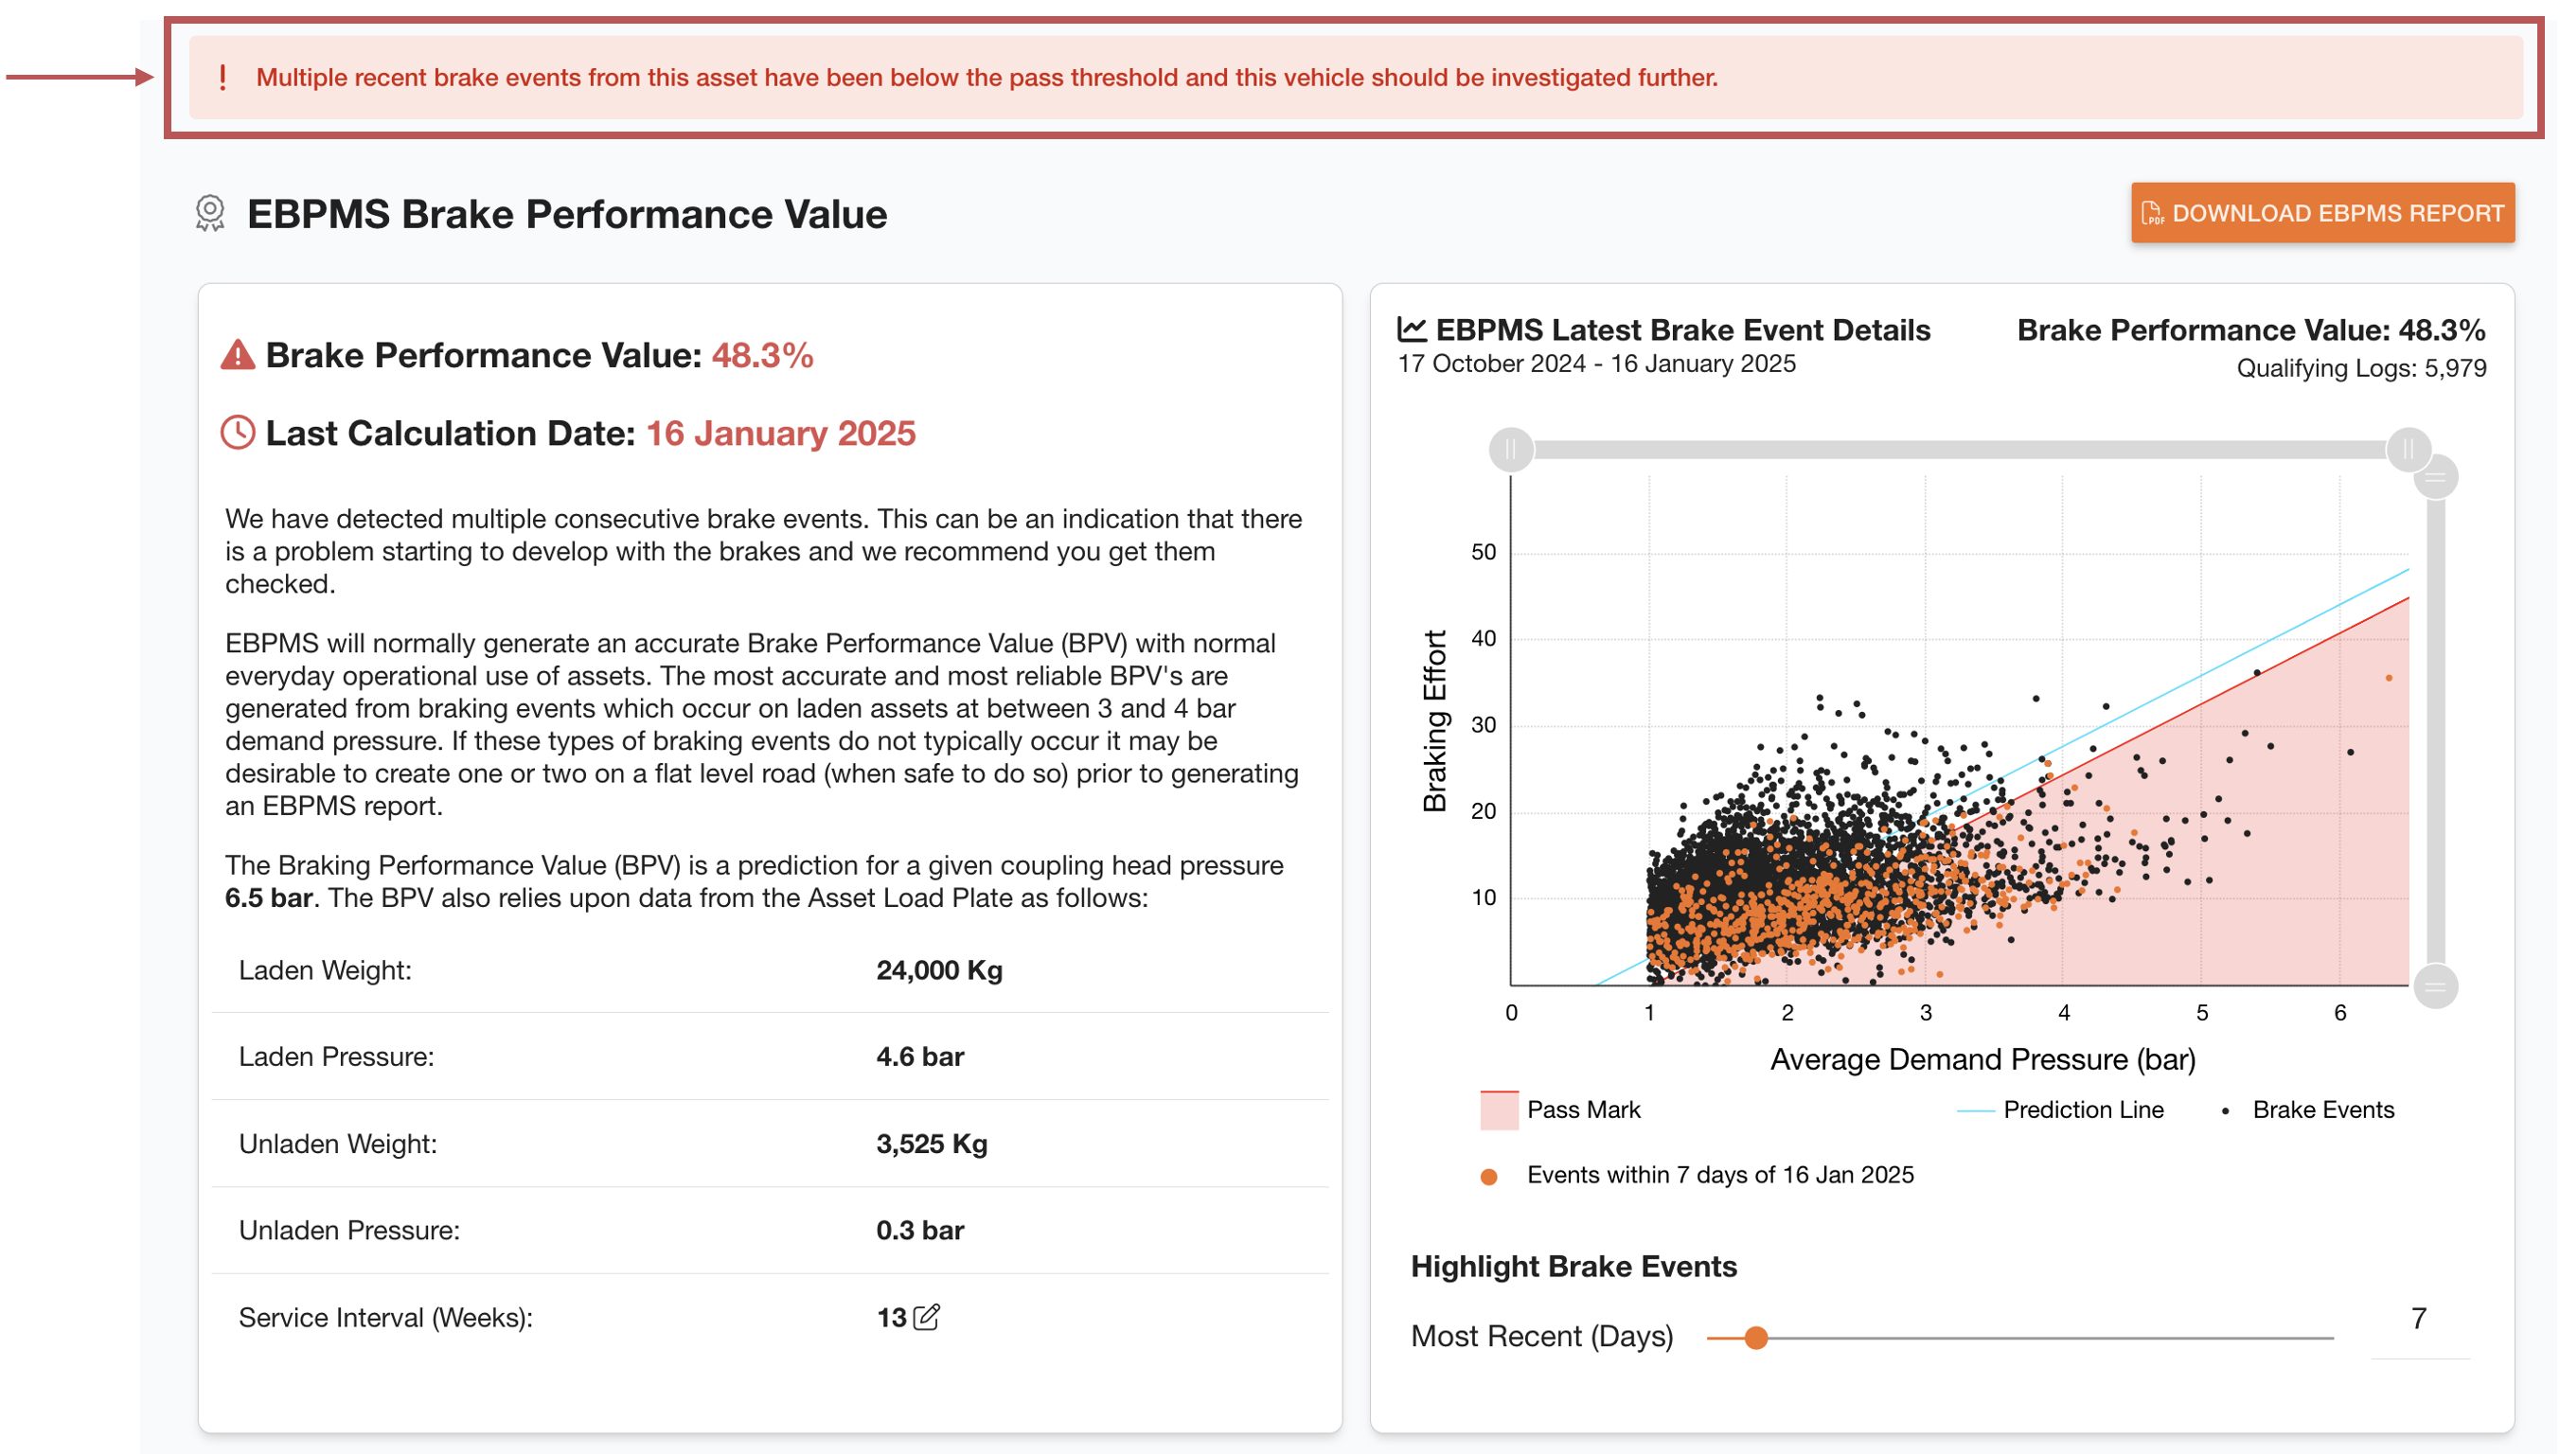
You may also notice a warning symbol in the EBPMS column of your fleet grid.

User-Led Analysis
Alongside the current BPV and system checks, we recommend that users regularly utilise the provided data and charts to gain deeper insights into the asset's performance. This will help you promptly identify and address any declines in performance. Taking this proactive approach helps to keep your fleet safe.
We suggest you regularly:
-
Review the latest brake events.
-
Review BPV trends and changes.
Review recent brake events
To analyse the brake event data you can use the EBPMS Latest Brake Event Details chart to check the most recent brake events.
In the below example, there is a significant amount of orange points (brake events in the last 7 days) below the pass mark. This may indicate a potential issue with brake performance which is not yet reflected in the BPV.
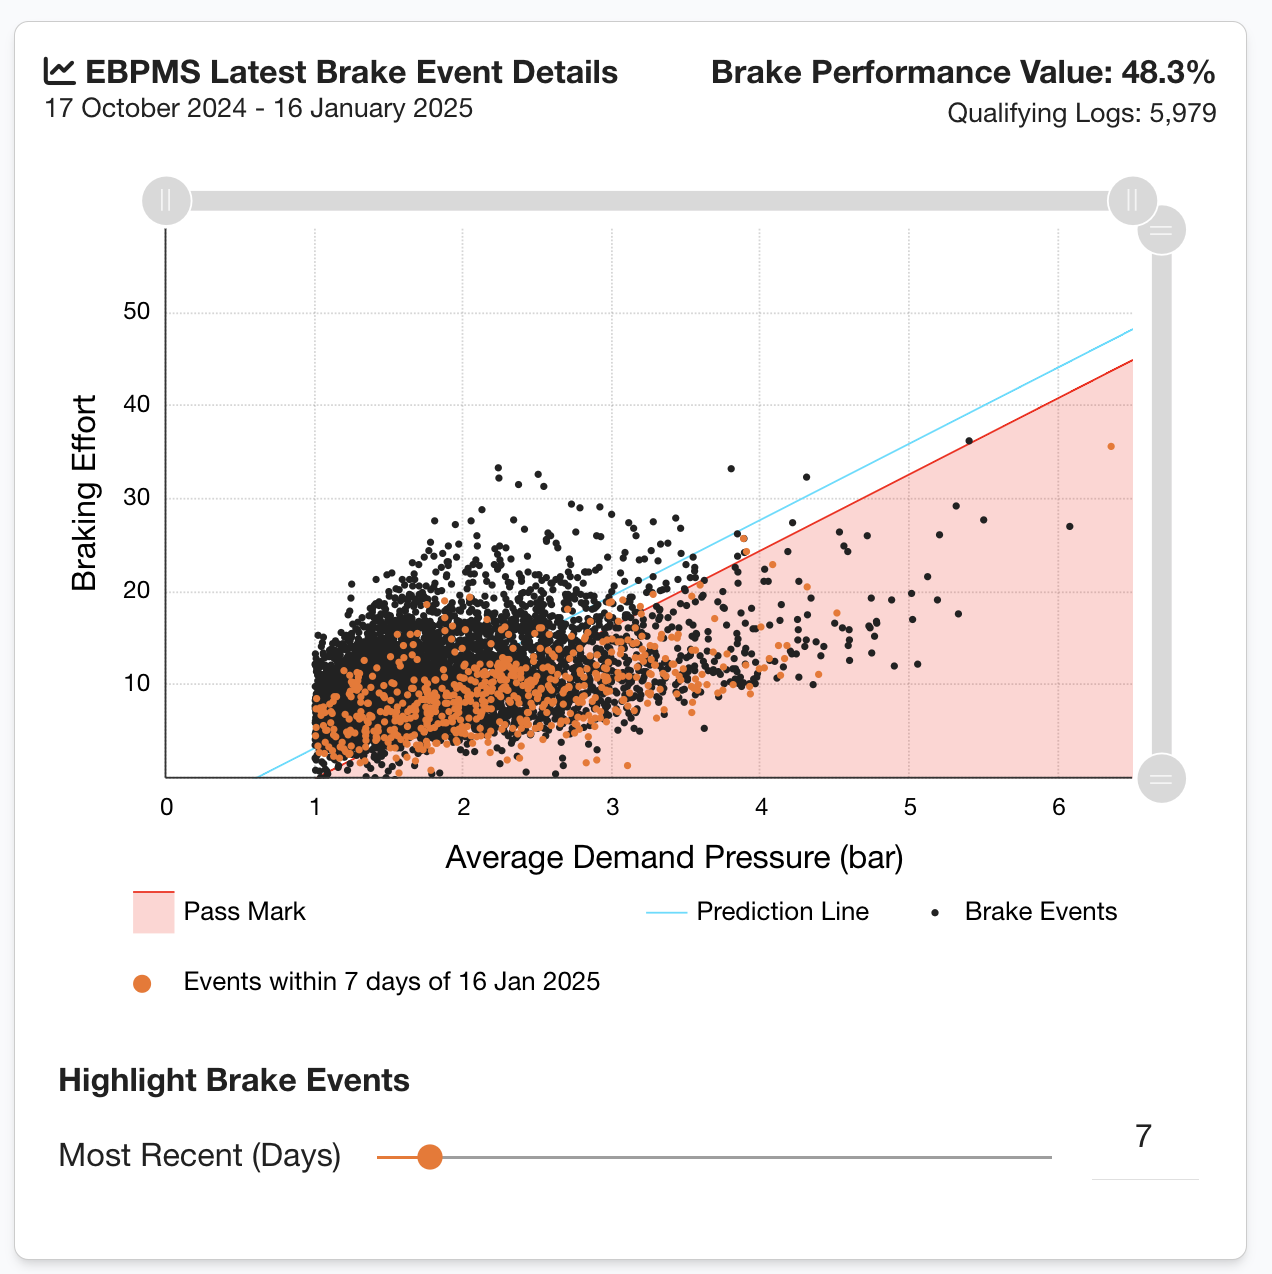
You can drag the slider to adjust the amount of days highlighted on the graph.
Review historical BPV
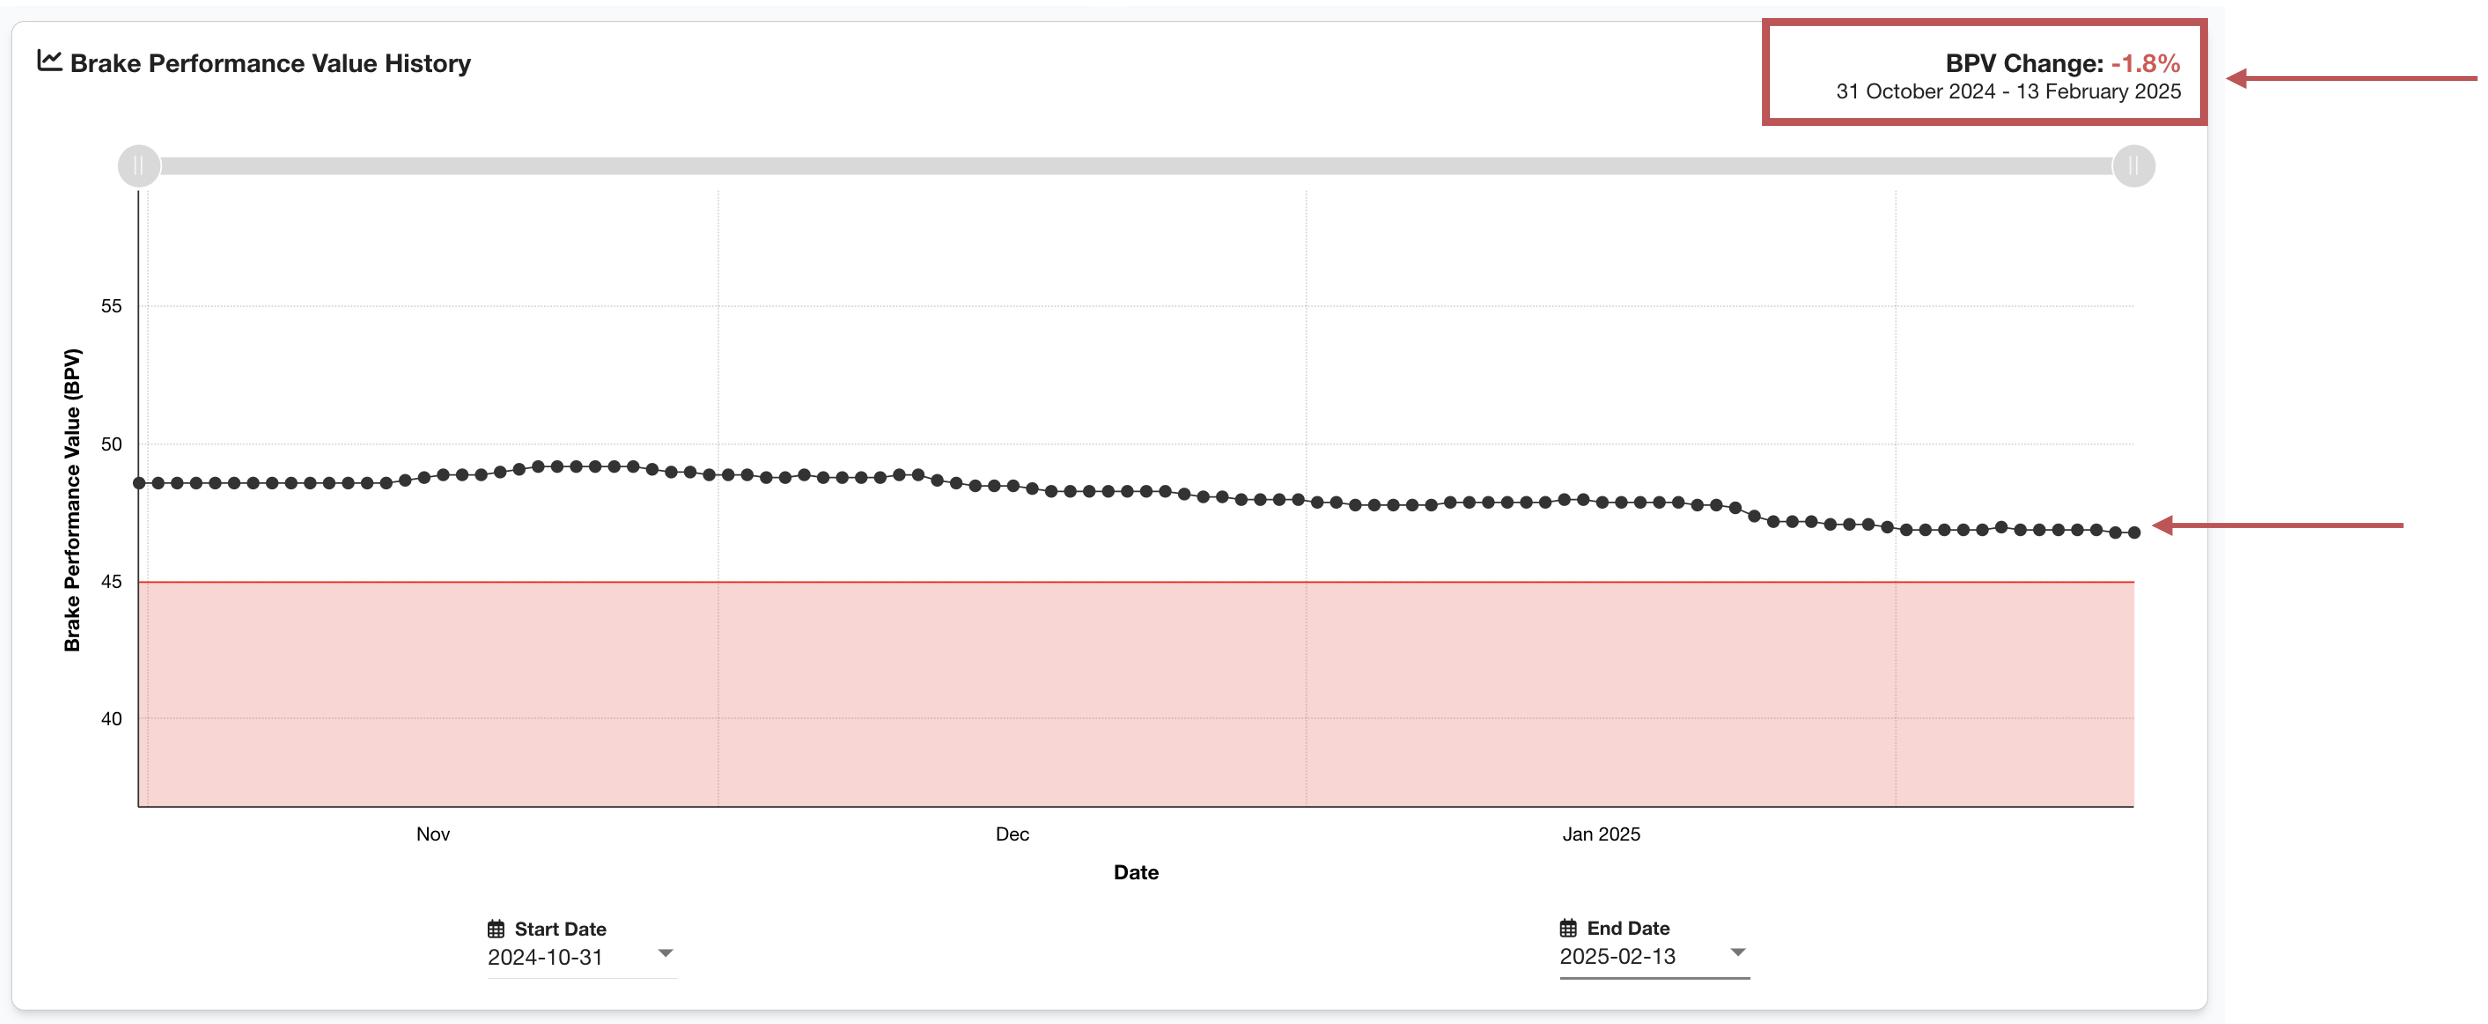
The Brake Performance Value History graph shows the historical BPV values recorded each day, plotted on a graph. You can also see the BPV Change percentage, which shows the increase or decrease in BPV ( % ). It is useful to compare recent performance against past benchmarks.
If the BPV is dropping each day, this could indicate an issue with the asset.
In this example of brake deterioration below, you can see the trend line is skewing downwards as the BPV decreases each day. As the number of good brake events decreases and bad events increase in the BPV calculation, this score will continue to fall until a failing score is reached.
Resetting EBPMS
It is important toReset EBPMSwhen applicable. The EBPMS Reset option on the EBPMS section allows you to inform the system of a change in performance in the asset’s brakes
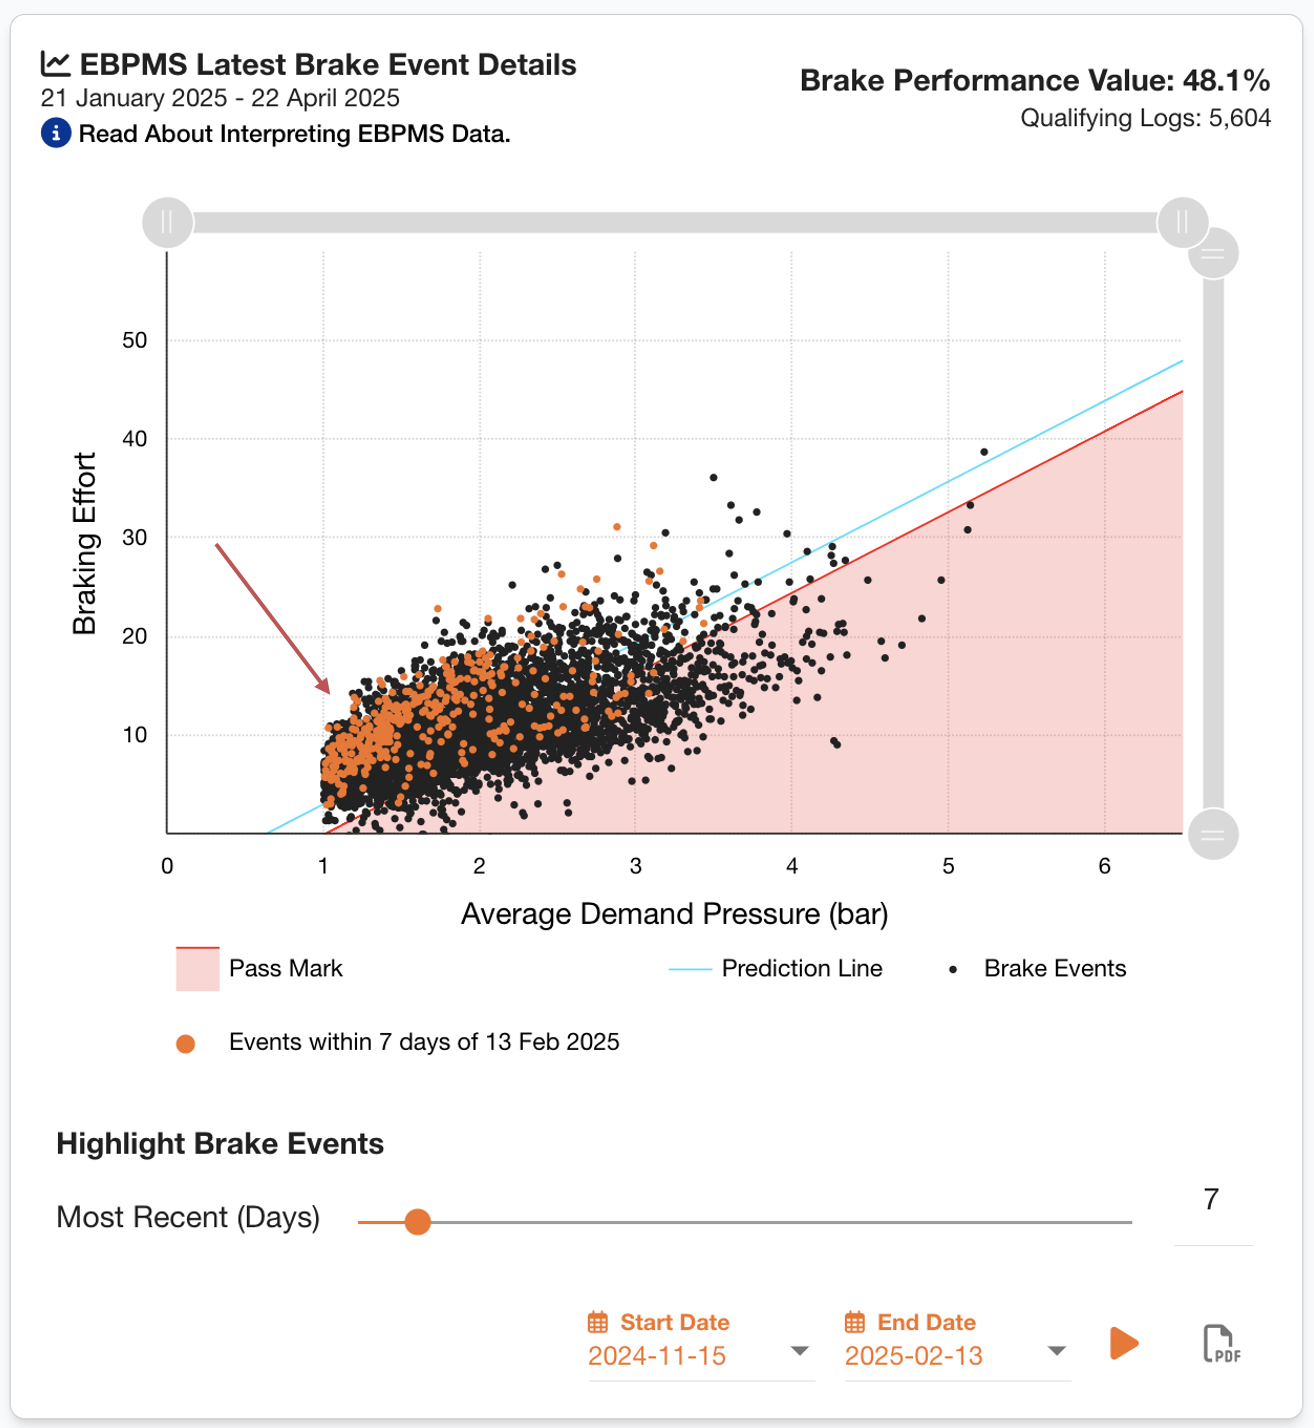
Keeping your EBPMS Reset after changes to your asset will keep your EBPMS score accurate. Here is an example of where we can identify that a brake's performance is improving.
For instance, in the example graph below, all the orange points represent recent brake events that have consistently scored above the pass threshold - indicating a clear improvement in performance.
Regularly resetting EBPMS when applicable will mean new BPVs are calculated (excluding the data before the reset date). This helps maintain the integrity of your asset data and ensures more reliable safety monitoring.
What should you do when a trailer’s reported EBPMS braking performance drops below 45%?
-
It should be remembered that the performance reported by an EBPMS is an average of that performance over a period, so any actions should take that into consideration.
-
Similarly, the performance is for the trailer-tractor unit combination and not just the trailer and should take into consideration any short-term influence of a tractor unit on the reported performance.
-
The degree of the decline and over what period it covers should be considered. The data should be examined and a decision made with regards to any action to be taken based on, for example, whether it is deemed that the trailer can continue to operate safely until it is next safety inspection whereby further investigation can take place. If the performance reduction is reported as significant, then it should be inspected at the earliest opportunity.