.png)
The Load page breaks down the current load of an asset. With different tools you can customise the chart to only show the relevant data for you.
🧭 Getting to Load
You’re on the Asset View page.
-
Click Load in the left side bar.
The Load page will open.
📚 Load Information
|
No. |
Description |
|---|---|

|
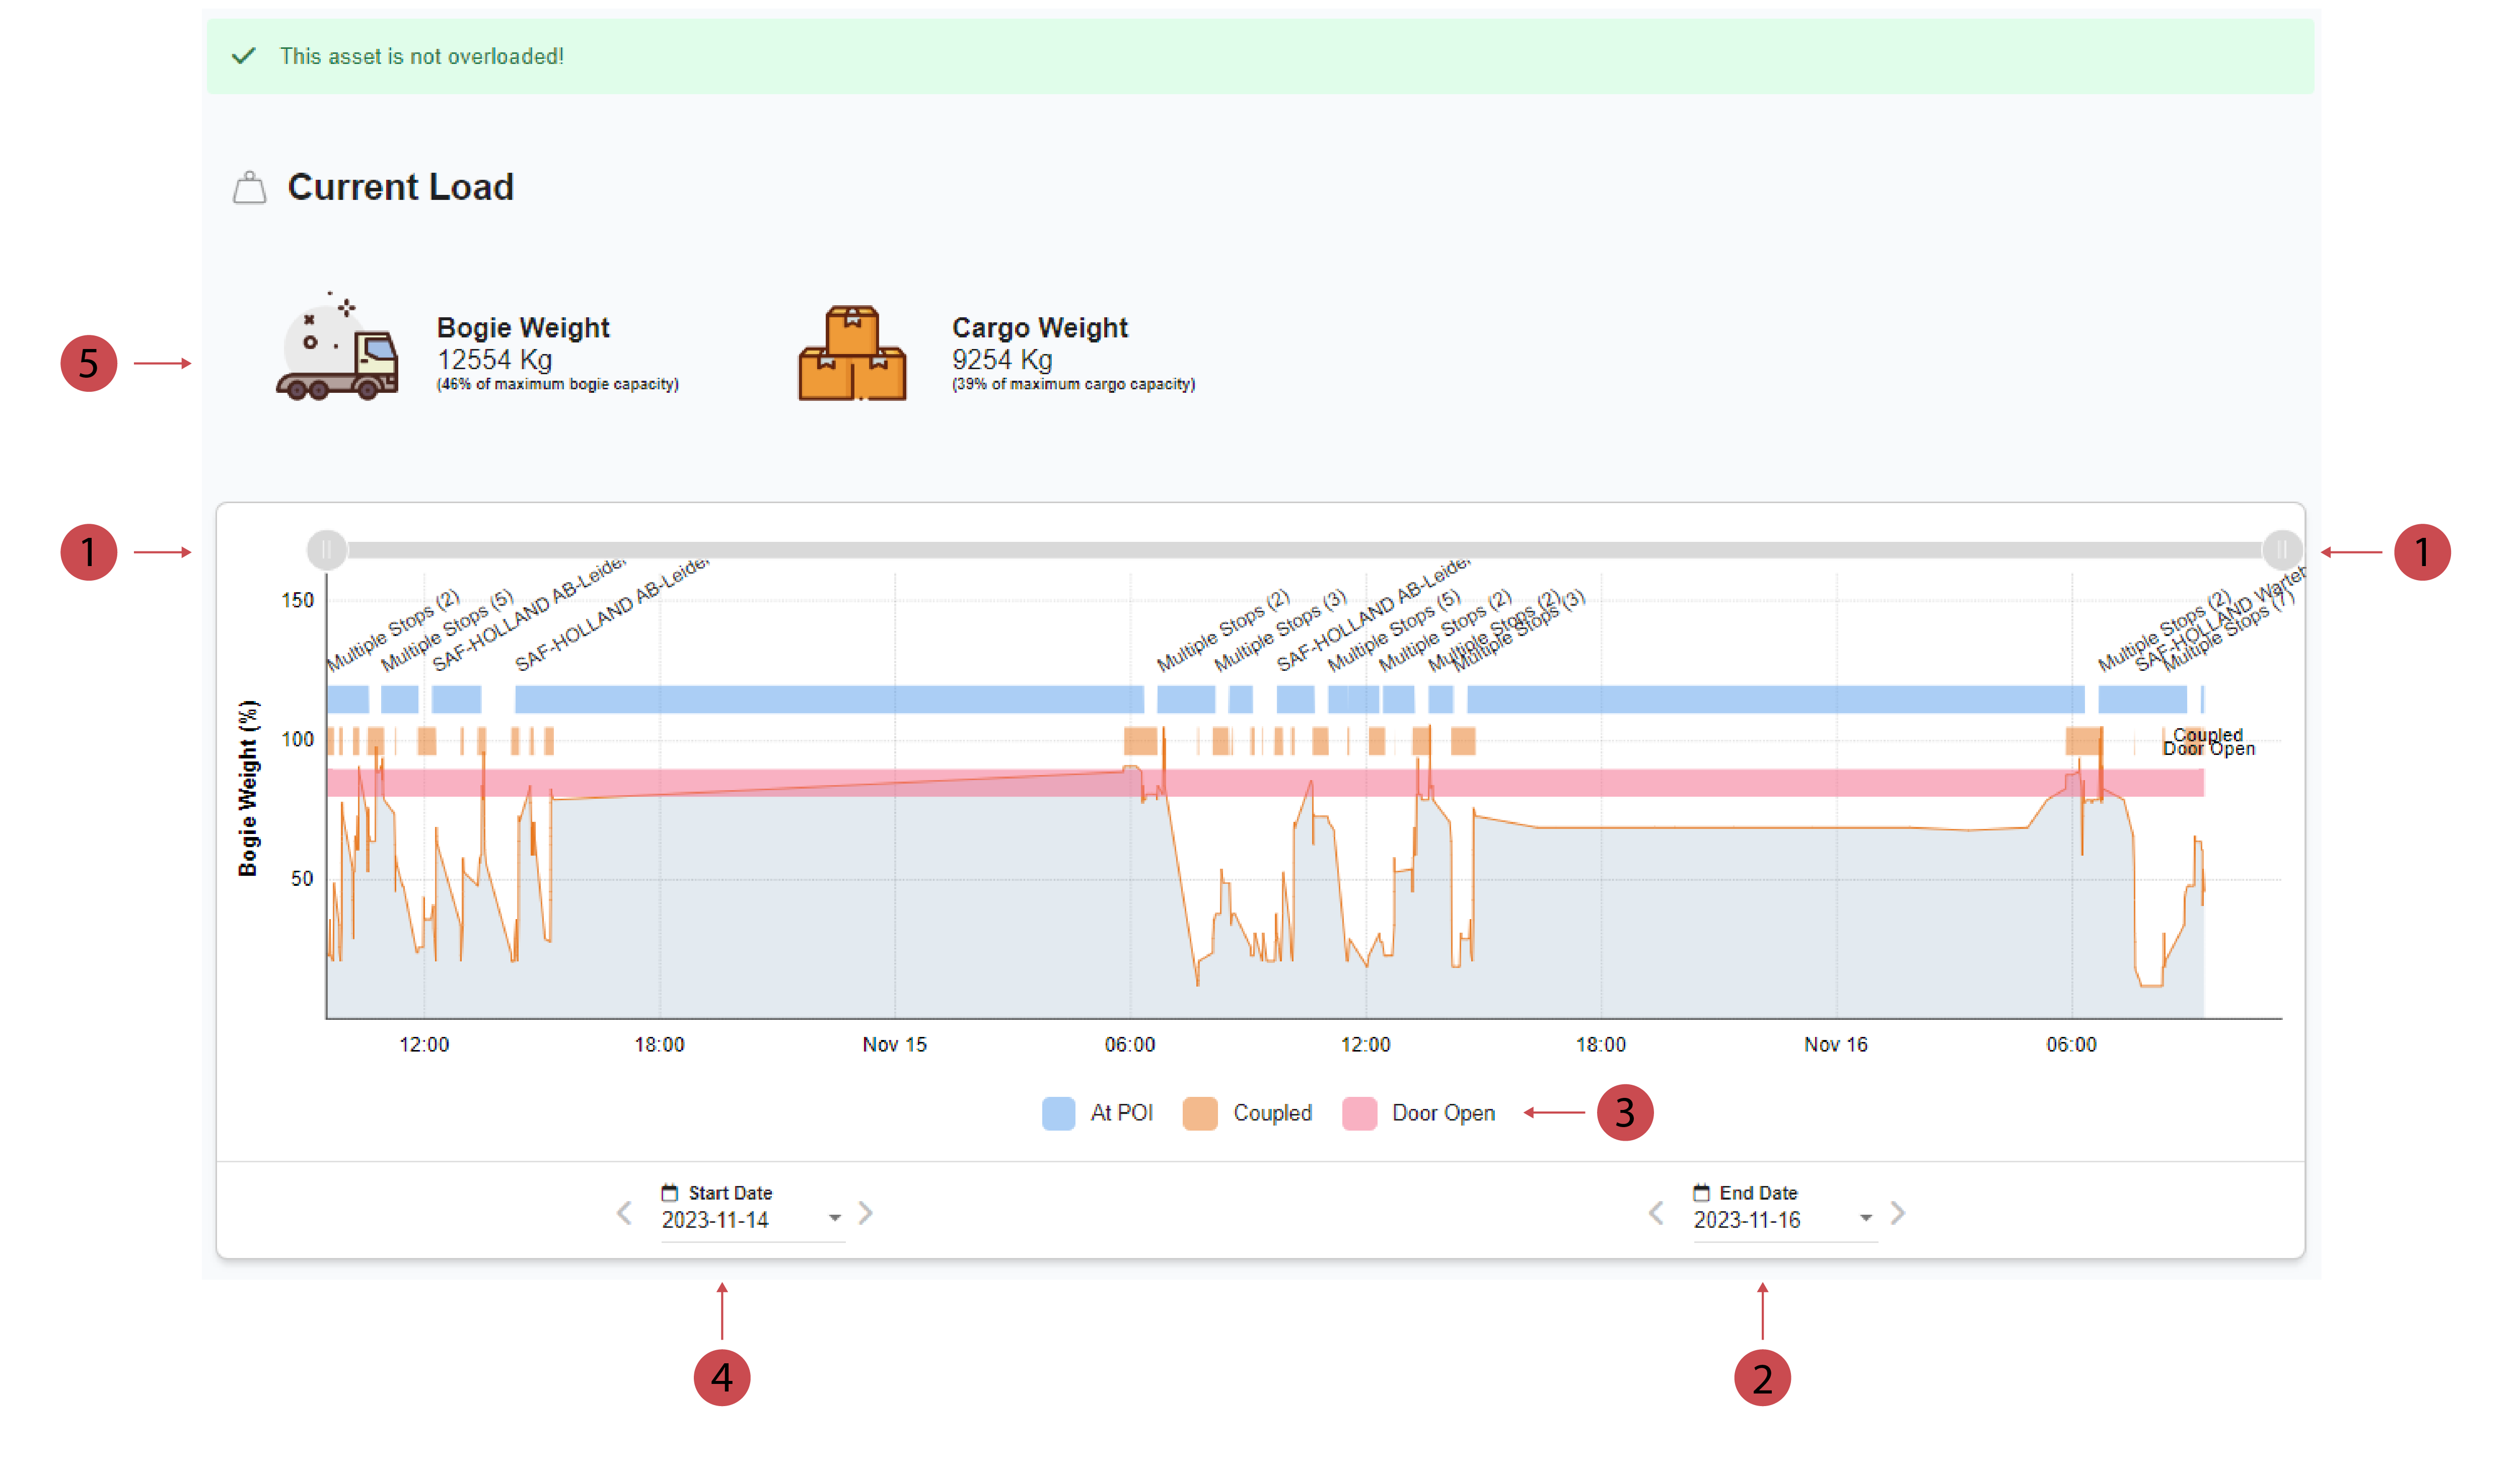
Zoom Bar You can zoom in and out of the graph using the zoom bar. When you toggle the left side to the right the shown time period shows the data closer to the selected end date in more detail. When you toggle the right side to the left the shown time period shows the data closer to the selected start date in more detail. |

|
End Date You can select the End Date you want to apply to the chart from the calendar. |

|
Chart Legend The chart legend explains what the different colours represent and help you understand the chart better. |

|
Start Date You can select the Start Date you want to apply to the chart from the calendar. |

|
Current Bogie Weight and Cargo Weight The Current bogie weight is made up of the cargo weight added to the weight of the unloaded trailer. The cargo weight is the weight of the things loaded onto the asset. |
🛠️ Load Features
Using the Zoom Bar
You’re on the Asset View.
You’re on the Load page.
-
Use the zoom bar and either toggle it from the left side to the right side or the other way around.
The load chart will adapt accordingly.