.png)
Go to the Analysis page to see how to get here.
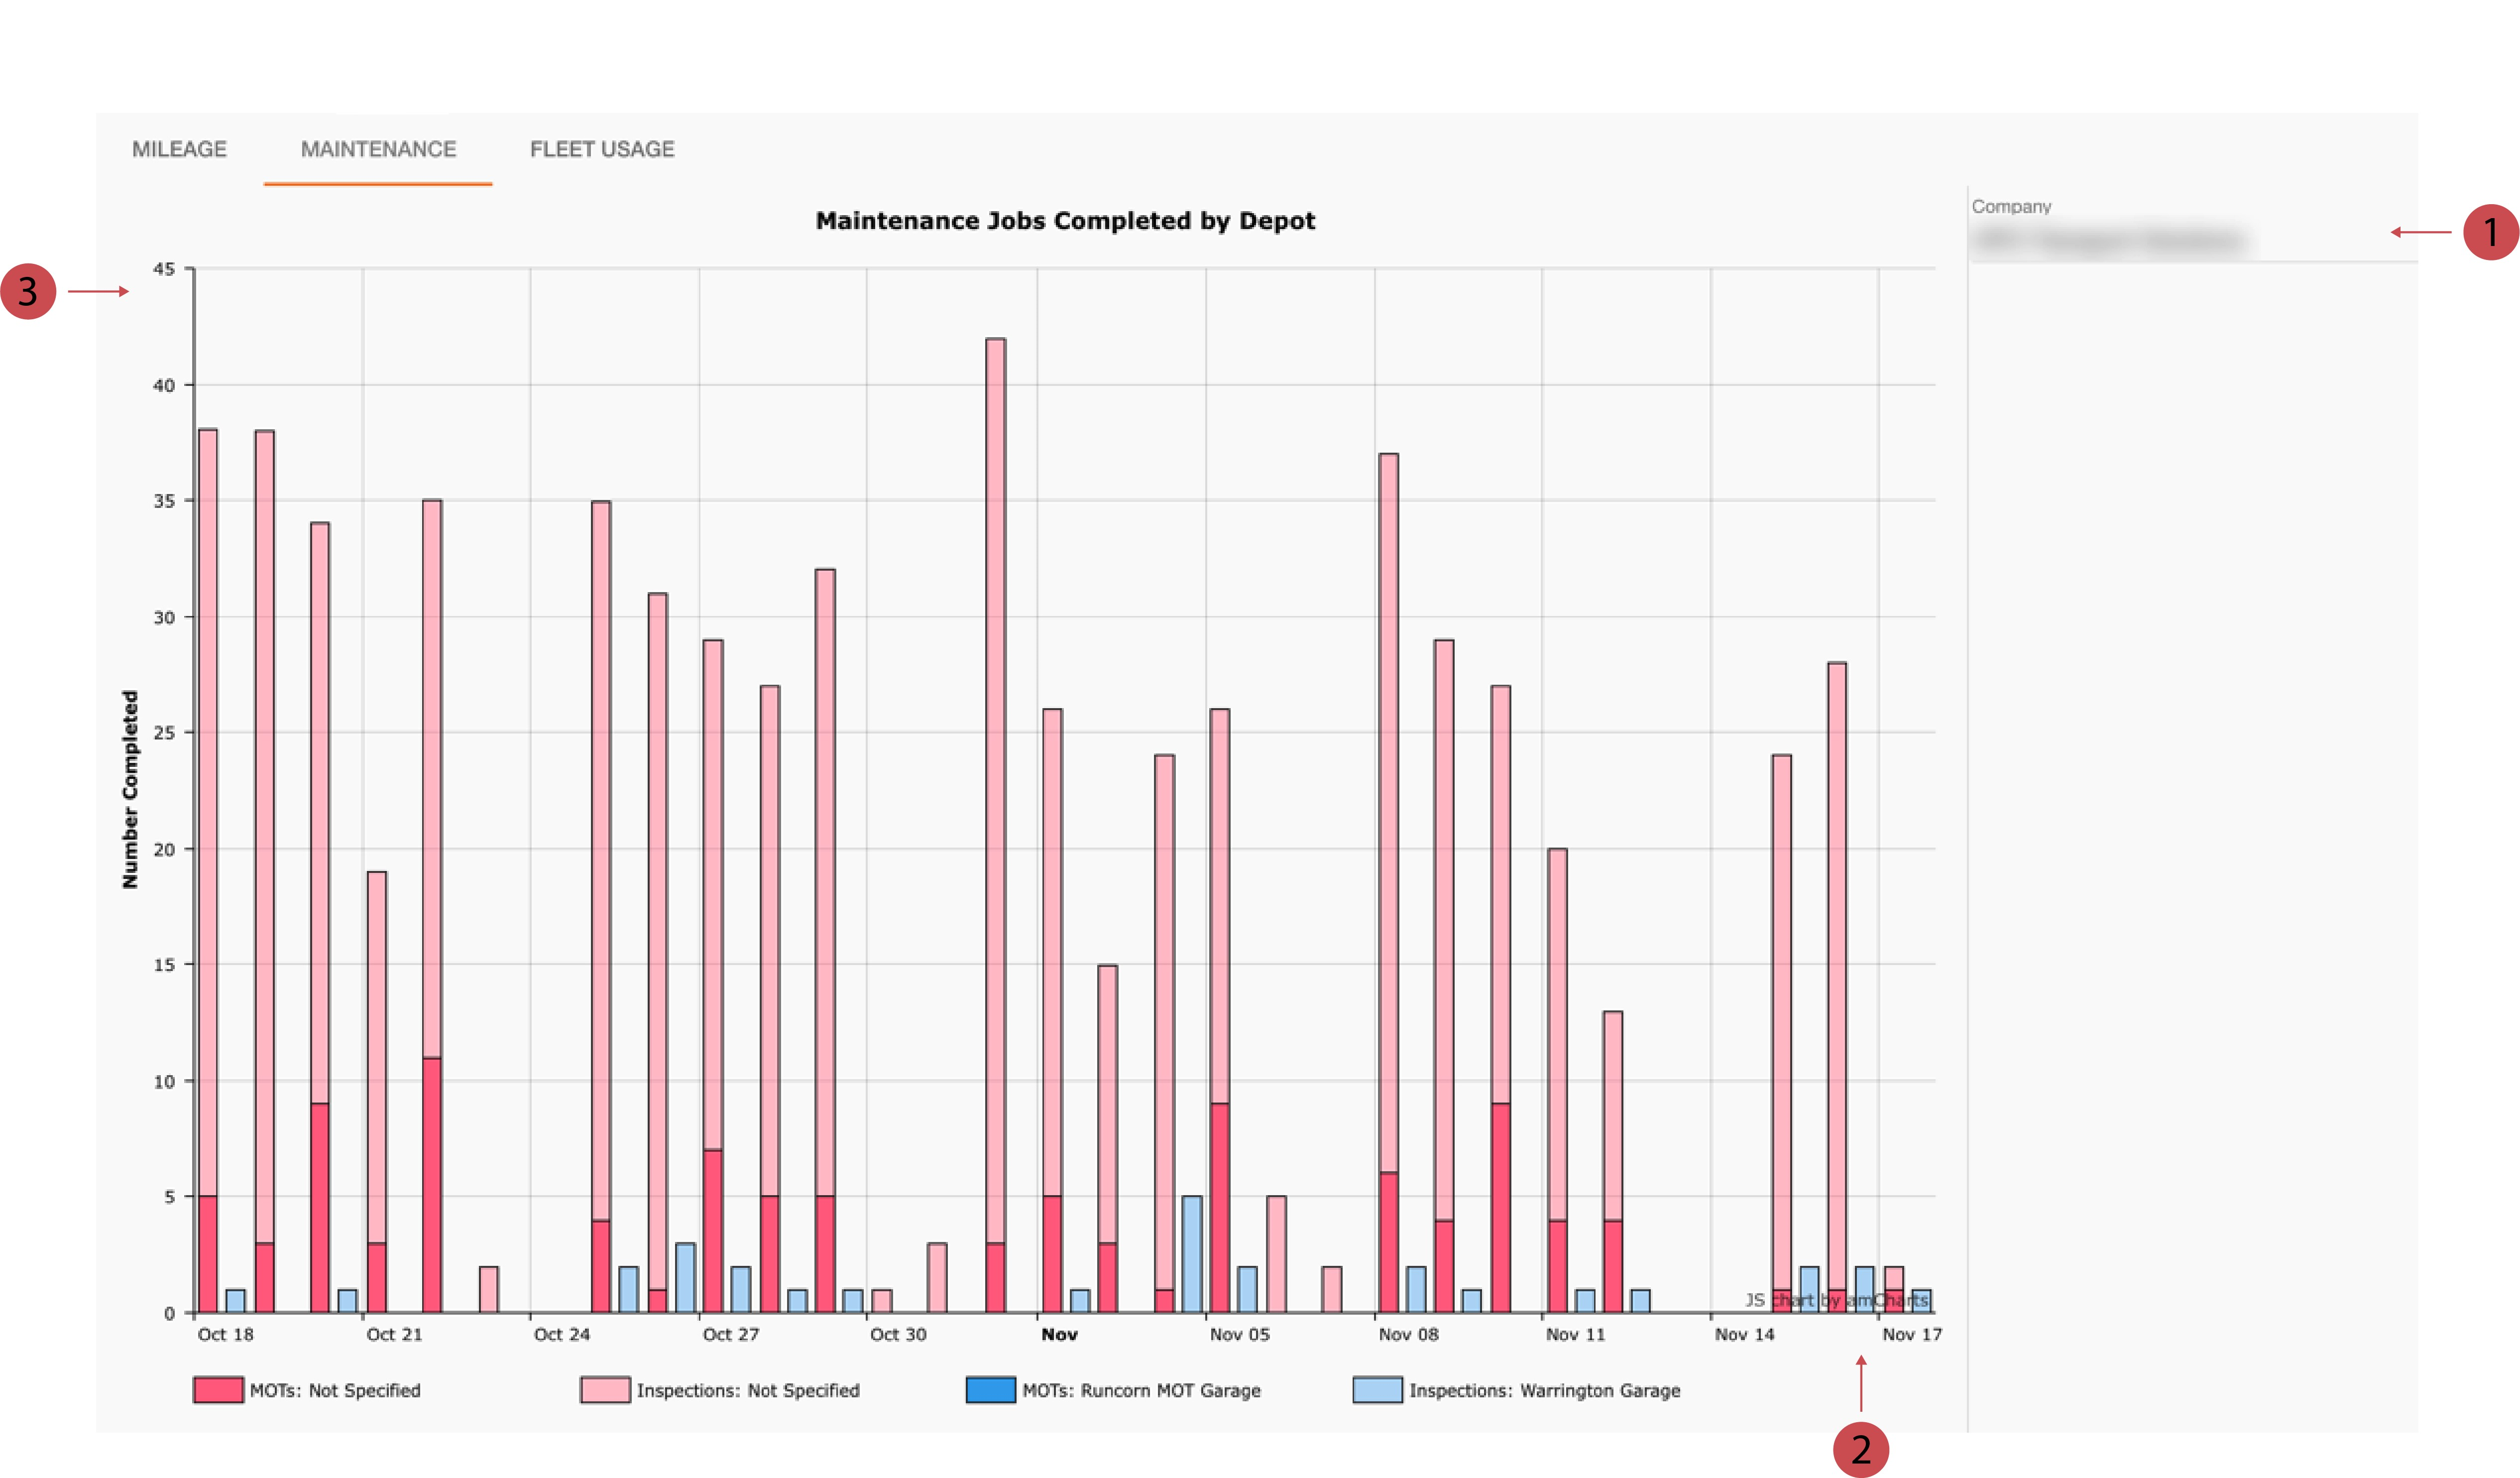
You’re on the Analysis page.
You’re on the Maintenance tab.
The main feature of the Maintenance page is a stacked bar chart. Along the y-axis is the count of maintenance events; along the x-axis is a 1 month timeline counting back from the current date. The bars show the frequency of maintenance events, with the stacked bars representing different depots.
You can hover over an individual stacked bar to see insight.
The maintenance graph specifically highlights MOTs and general inspections.
|
No. |
Description |
|---|---|

|
Chaning Companies If you belong to more than one company, you can change the company on the right hand side of the graph using the dropdown. |
|
x-axis Along the x-axis is a 1 month timeline counting back from the current date |
|
y-axis Along the y-axis is the amount of maintenance events. |