.png)
You can monitor the tyre pressure and the temperature of the asset. Initially, you’ll see a quick overview of the sensors used on the asset and their current state.
Follow the link for more information about TPMS.
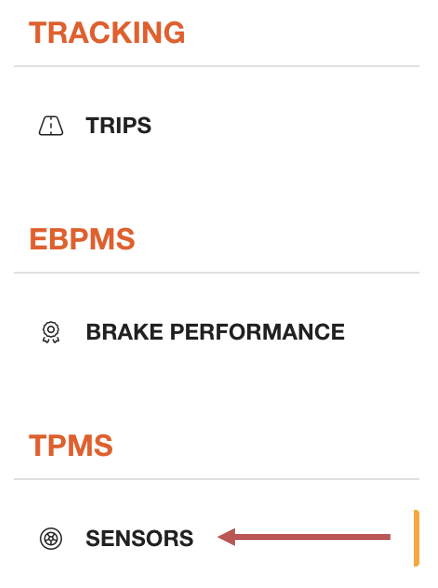
🧭 Getting to TPMS
You’re on the Asset View.
-
Click Sensors in the left side bar.
The TPMS page will open.
📚 TPMS Information
|
No. |
Description |
|---|---|

|
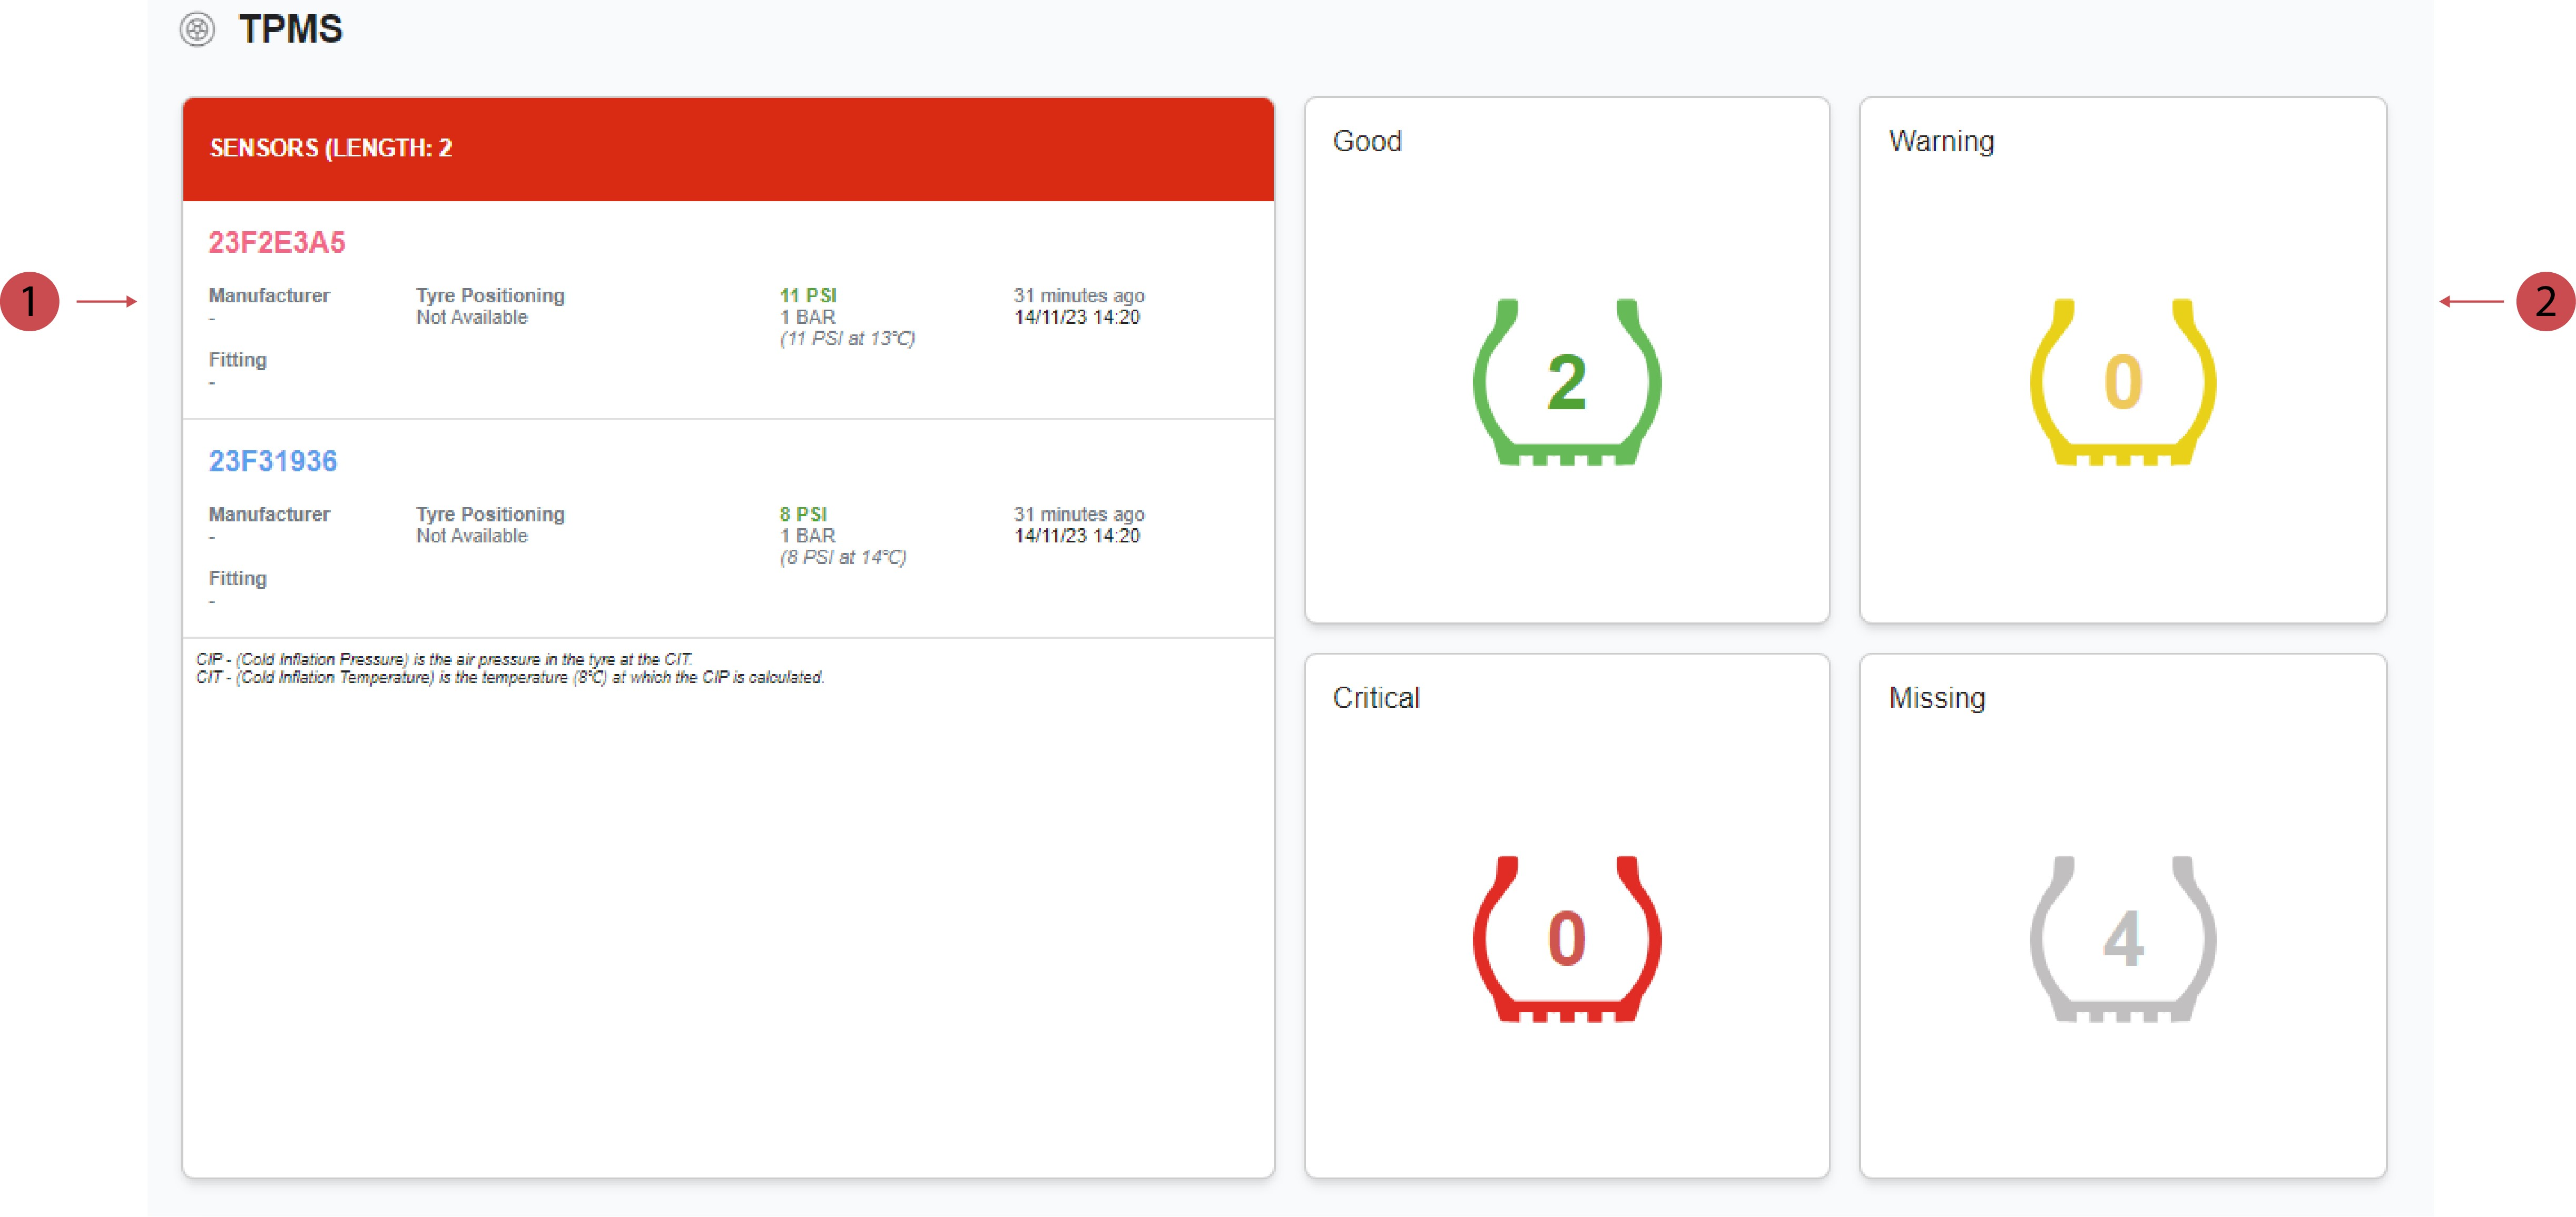
TPMS Sensors
|
|
Sensor Status There are four different sensor states: Good, Warning, Critical and Missing. The different colours indicate the current state of the active sensors or the number of missing sensors. |
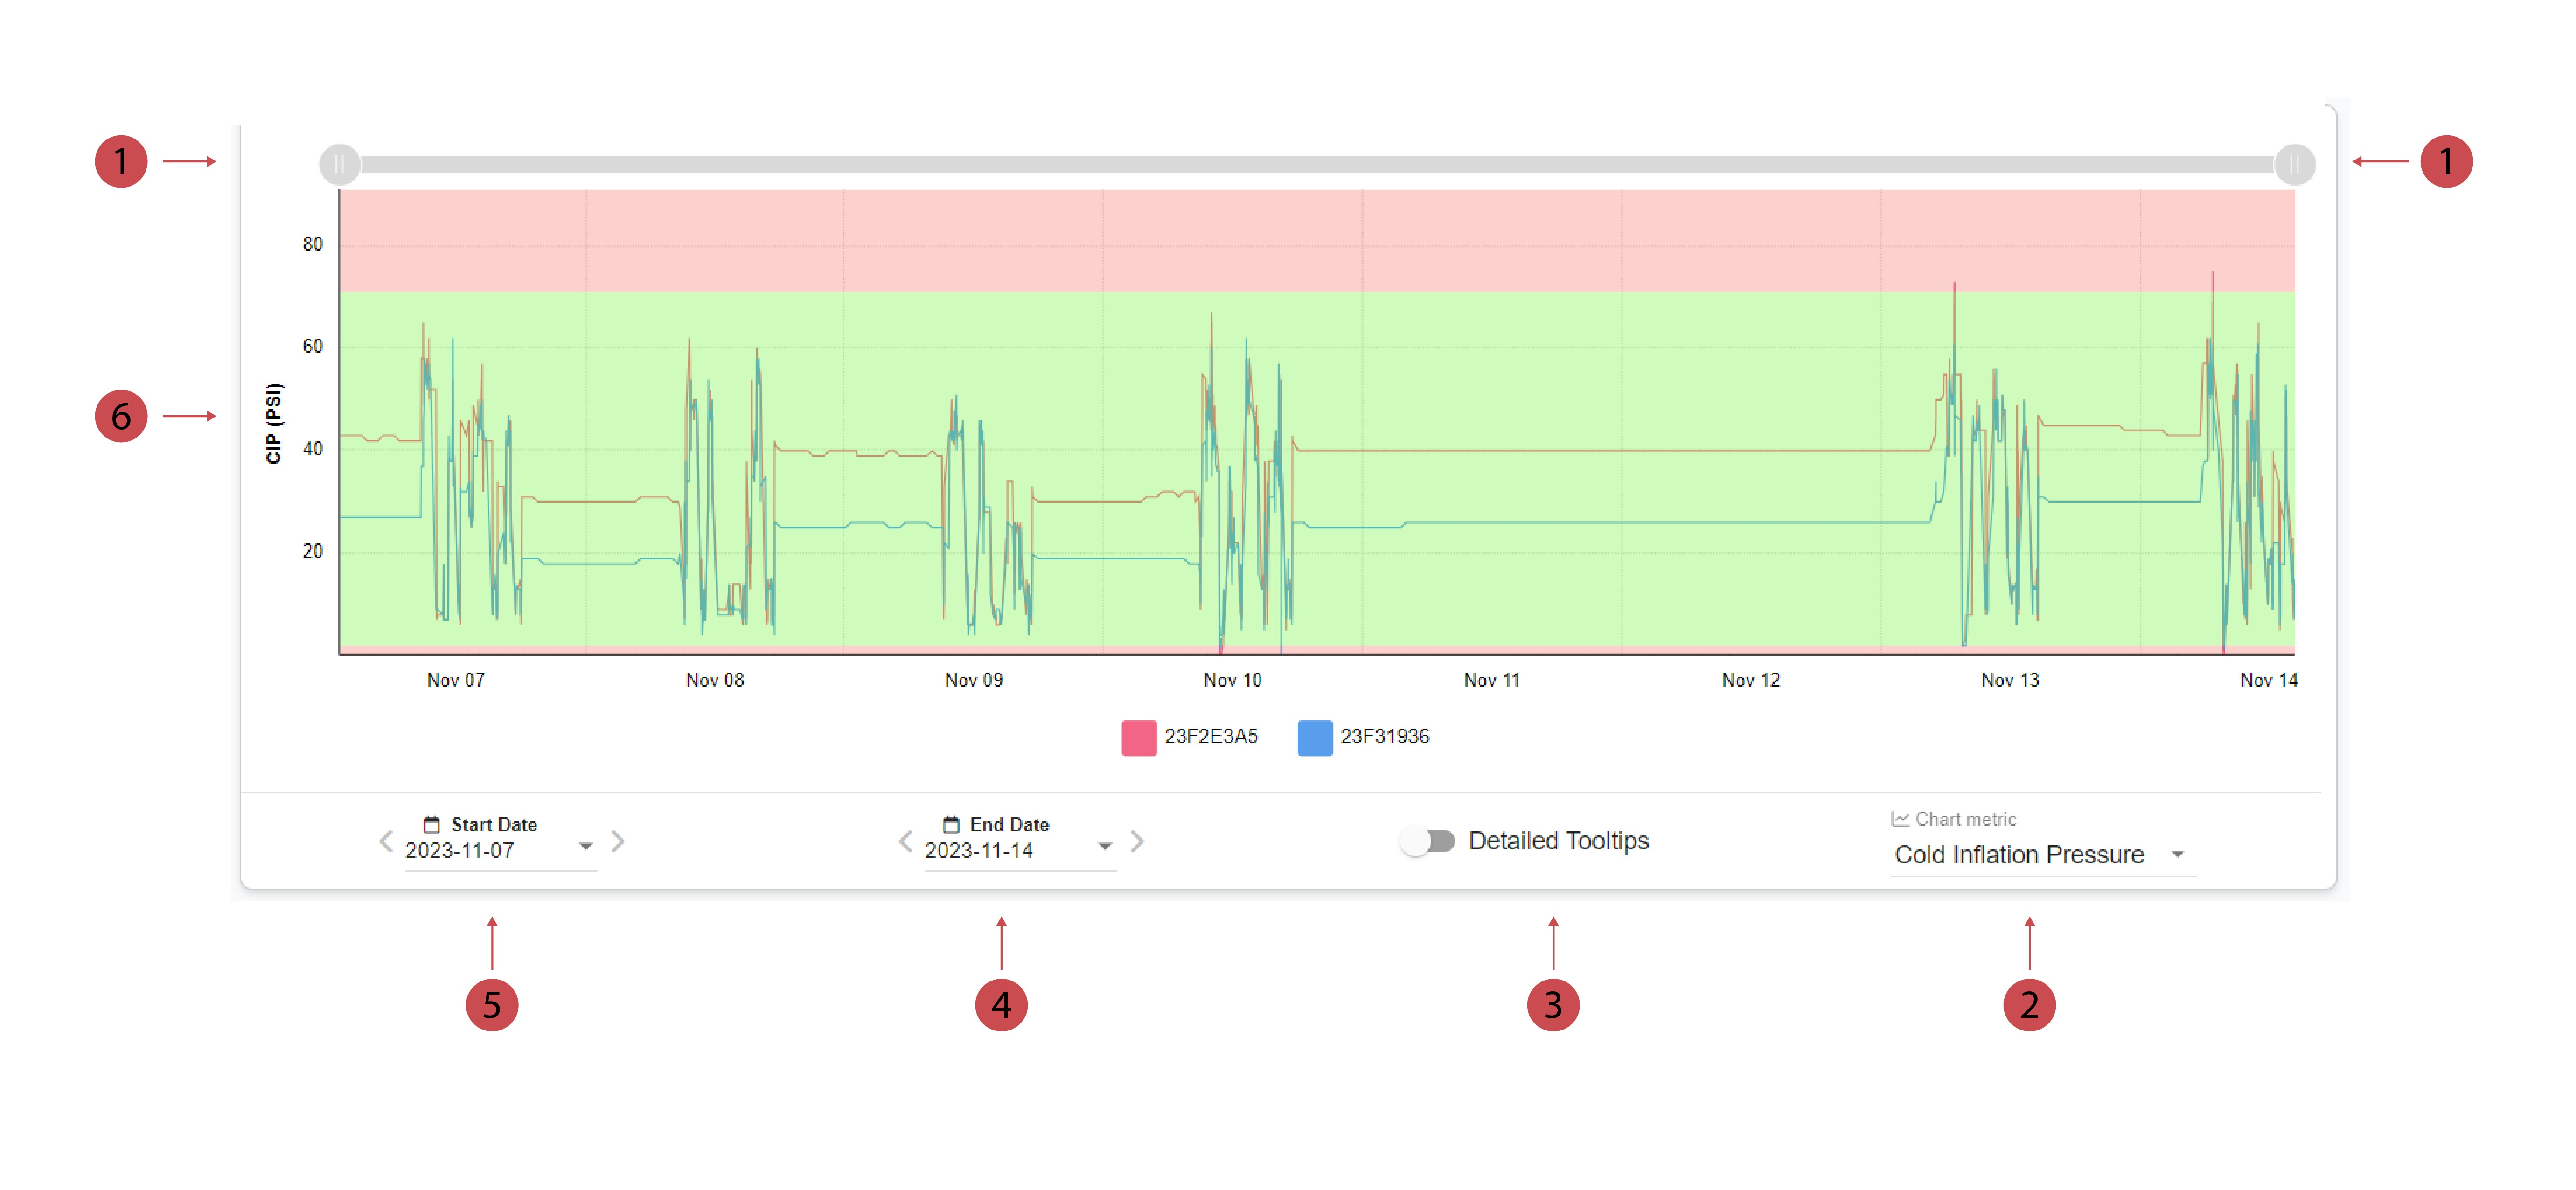
Tyre Pressure Chart
This chart shows the collected tyre pressure data from the sensors. With the different tools you can customise the chart to only show the relevant data for you. The sensors are represented in different colors to help you easily distinguish between them.
Clicking on any of the sensors in the legend will show/hide them from the graph.
|
No. |
Description |
|---|---|
|
|
Zoom Bar You can zoom in and out of the graph using the zoom bar. When you drag each side of the zoom bar, it narrows the time period shown. |
|
|
Chart Metric You can change the chart metric by selecting a different option from the drop down. You can choose between the Cold Inflation Pressure and the Recorded Pressure. |

|
Detailed Tooltips You can toggle this button to activate and deactivate the detailed tooltips. |

|
End Date You can select the End Date you want to apply to the chart from the calendar. |

|
Start Date You can select the Start Date you want to apply to the chart from the calendar. |

|
Cold Inflation Pressure (CIP) The Cold Inflation Pressure is the air pressure in the tyre at the CIT.
|
Temperature Chart
This chart shows the collected tyre pressure data from the sensors.
To zoom in and out of the chart and only view the data that's relevant to you, use the zoom bar. You can move the start date by dragging the left button along the bar, and move the end date by dragging the right button.
Reset the graph by clicking the blue minus button.
You can alter the maximum start and end dates by changing the date picker on the Tyre Pressure Chart.
.gif?cb=dbdc991d2a21e2acd938363cdc6d3508)