.png)
What is EBPMS?
EBPMS® is a useful tool for providing dynamic, live monitoring of your trailer’s braking performance. EBPMS has been included in the DVSA’s Guide to Roadworthiness.
By knowing how to properly utilise the EBPMS section you can stay compliant, reduce downtime, and replace laden roller brake testing with EBPMS.
EBPMS works by:
-
Monitoring and recording every brake event as it happens.
-
This data is adjusted to account for variables such as road angle and bogie weight.
-
Assessing enough brake events produces a BPV (Brake Performance Value).
-
The resulting data is plotted in an easy-to-read graph against the DVSA pass mark.
The Brake Performance Value is the average assessment of every qualifying brake event recorded within a monitoring period while in operational use. The default monitoring period or range is 13 weeks, but this can be changed to match your trailers service Interval (see Adjusting Service Interval Weeks to change the period brake events are assessed from)
What is the latest DVSA advice about EBPMS?
The DVSA suggests the following:
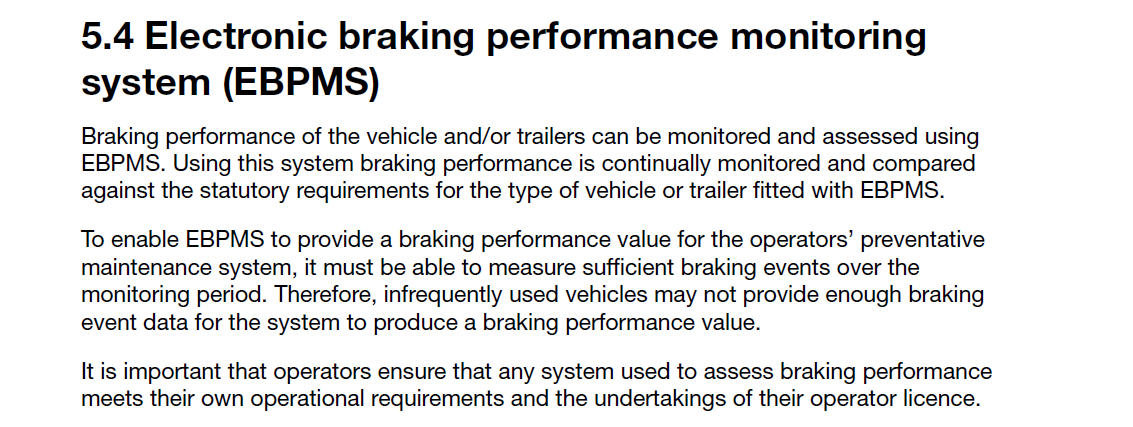
(2024) Guide to maintaining roadworthiness. Available at: https://assets.publishing.service.gov.uk/media/6751b5d044885d072cecbd62/guide-to-maintaining-roadworthiness-commercial-goods-and-public-service-vehicles.pdf (Accessed: January 2025).
Following this guidance, Axscend EBPMS assesses qualifying brake events within your Service Interval period to produce a BPV. It's important to adjust this interval to reflect the actual service schedule of your asset, and also Reset EBPMS on any assets which have recently been serviced.
See Generating an EBPMS Interval Report for guidance on creating an interval report.
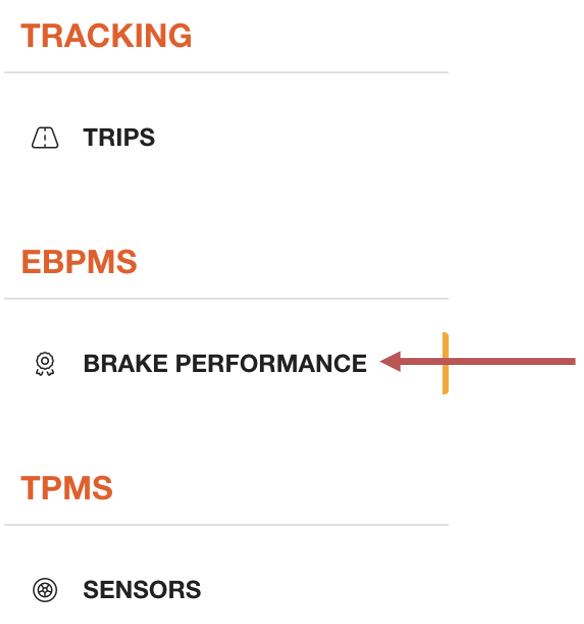
🧭 Getting to EBPMS
You’re on the Asset View.
-
Click Brake Performance in the left side bar.
The EBPMS page will open.
📚 EBPMS Information
|
No. |
Description |
|---|---|
|
|
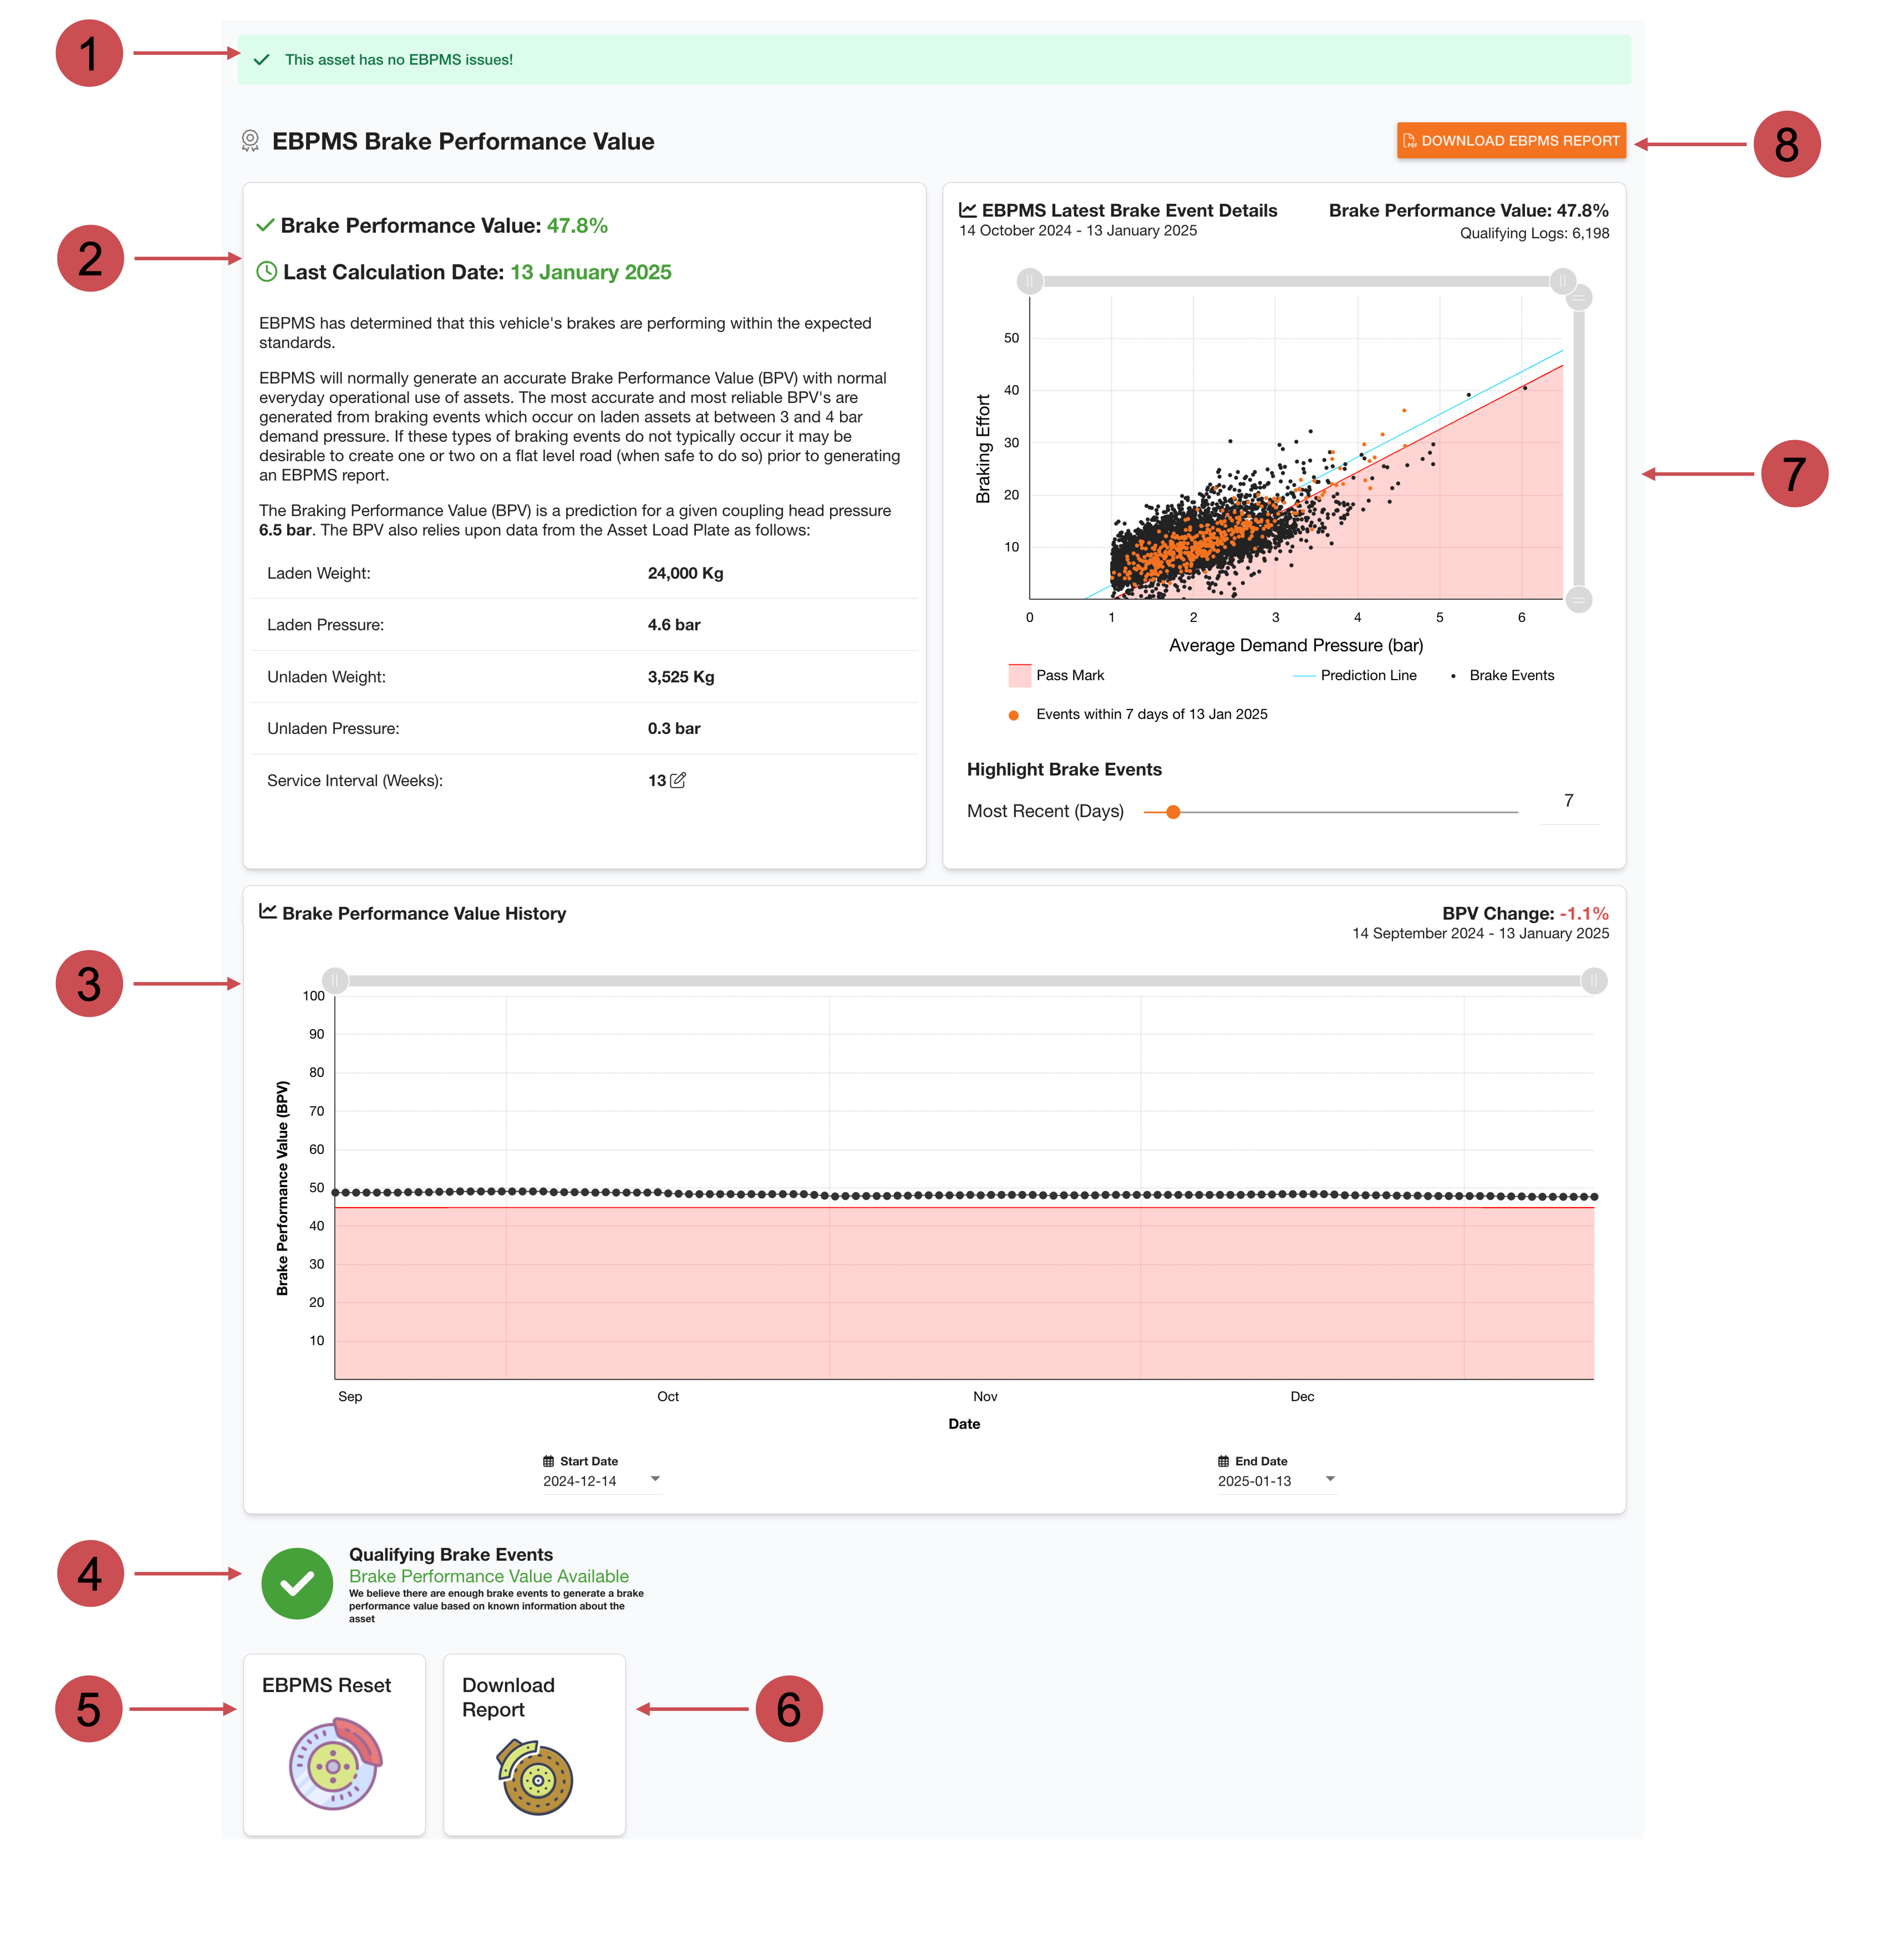
EBPMS Status This bar shows the overall status of EPBMS. It changes colour according to the status. Here, the asset has no EBPMS issues, and the status bar is green. |
|
|
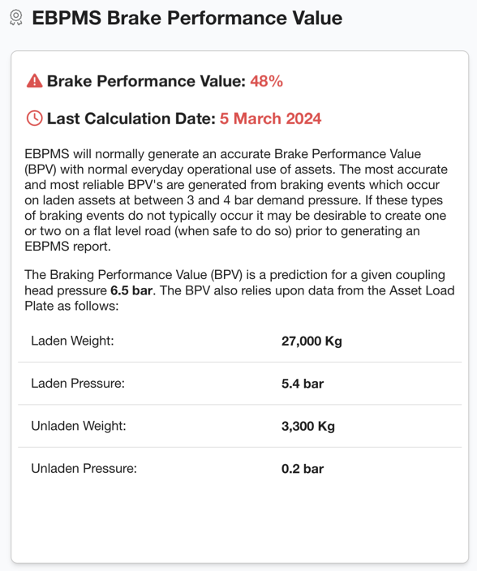
Brake Performance Value Overview This section shows when the most recent BPV was calculated and the load plate data used to generate it. |
|
|
Brake Performance Value History This section shows each BPV value recorded for this asset plotted on a graph. This helps to identify any declines in BPV. You can use the date pickers to change the timeline plotted. |
|
|
Qualifying Brake Logs This indicates whether the asset has enough qualifying brake logs to generate a Brake Performance Value (BPV). There may be instances where trailers are not in operation during certain seasons, are decommissioned, or have recently been fitted with a Data Collection Unit (DCU). In such cases, there might not be enough brake events recorded to generate a BPV. |
|
|
EBPMS Reset This allows you to reset EBPMS when a change on the trailer has occurred which may affect the brake performance. Brake events before this date will not be used in any future EBPMS calculations. |
|
|
Download EBPMS Report By clicking this button, a pop-up window will open, prompting you to download an EPMS report or generate an EBPMS Interval report. For further instructions on downloading or generating a report, please scroll down to the EBPMS Features section. |
|
|
Latest Brake Events Details This chart shows the asset's latest brake events which have been used to generate the current BPV. The orange points show the brake events over the last 7 days. |
EBPMS Latest Brake Event Details
The EBPMS Latest Brake Event Details section provides a detailed view of the data used to generate today's BVP score. This graph illustrates the recorded brake events for the asset that contributed to the calculation of this BPV score.
The orange points on the graph represent the brake events that occurred within the last X days, which defaults to 7 days. This feature is helpful for identifying any recent decline in brake performance over the specified number of days and makes it easier to locate potential issues.
You can adjust the highlighted number of days by modifying the most recent days slider or input box. Additionally, you can drag the axes to examine the plotted data more closely.
Brake Performance Value History Graph
The Brake Performance Value History Graph shows the plotted Brake Performance Values across a date range. The plotted Brake Performance Values are compared to the pass mark of 45%, which is illustrated with the shaded red region of the graph. You can hover over any point of the graph to view more information about the plotted value.
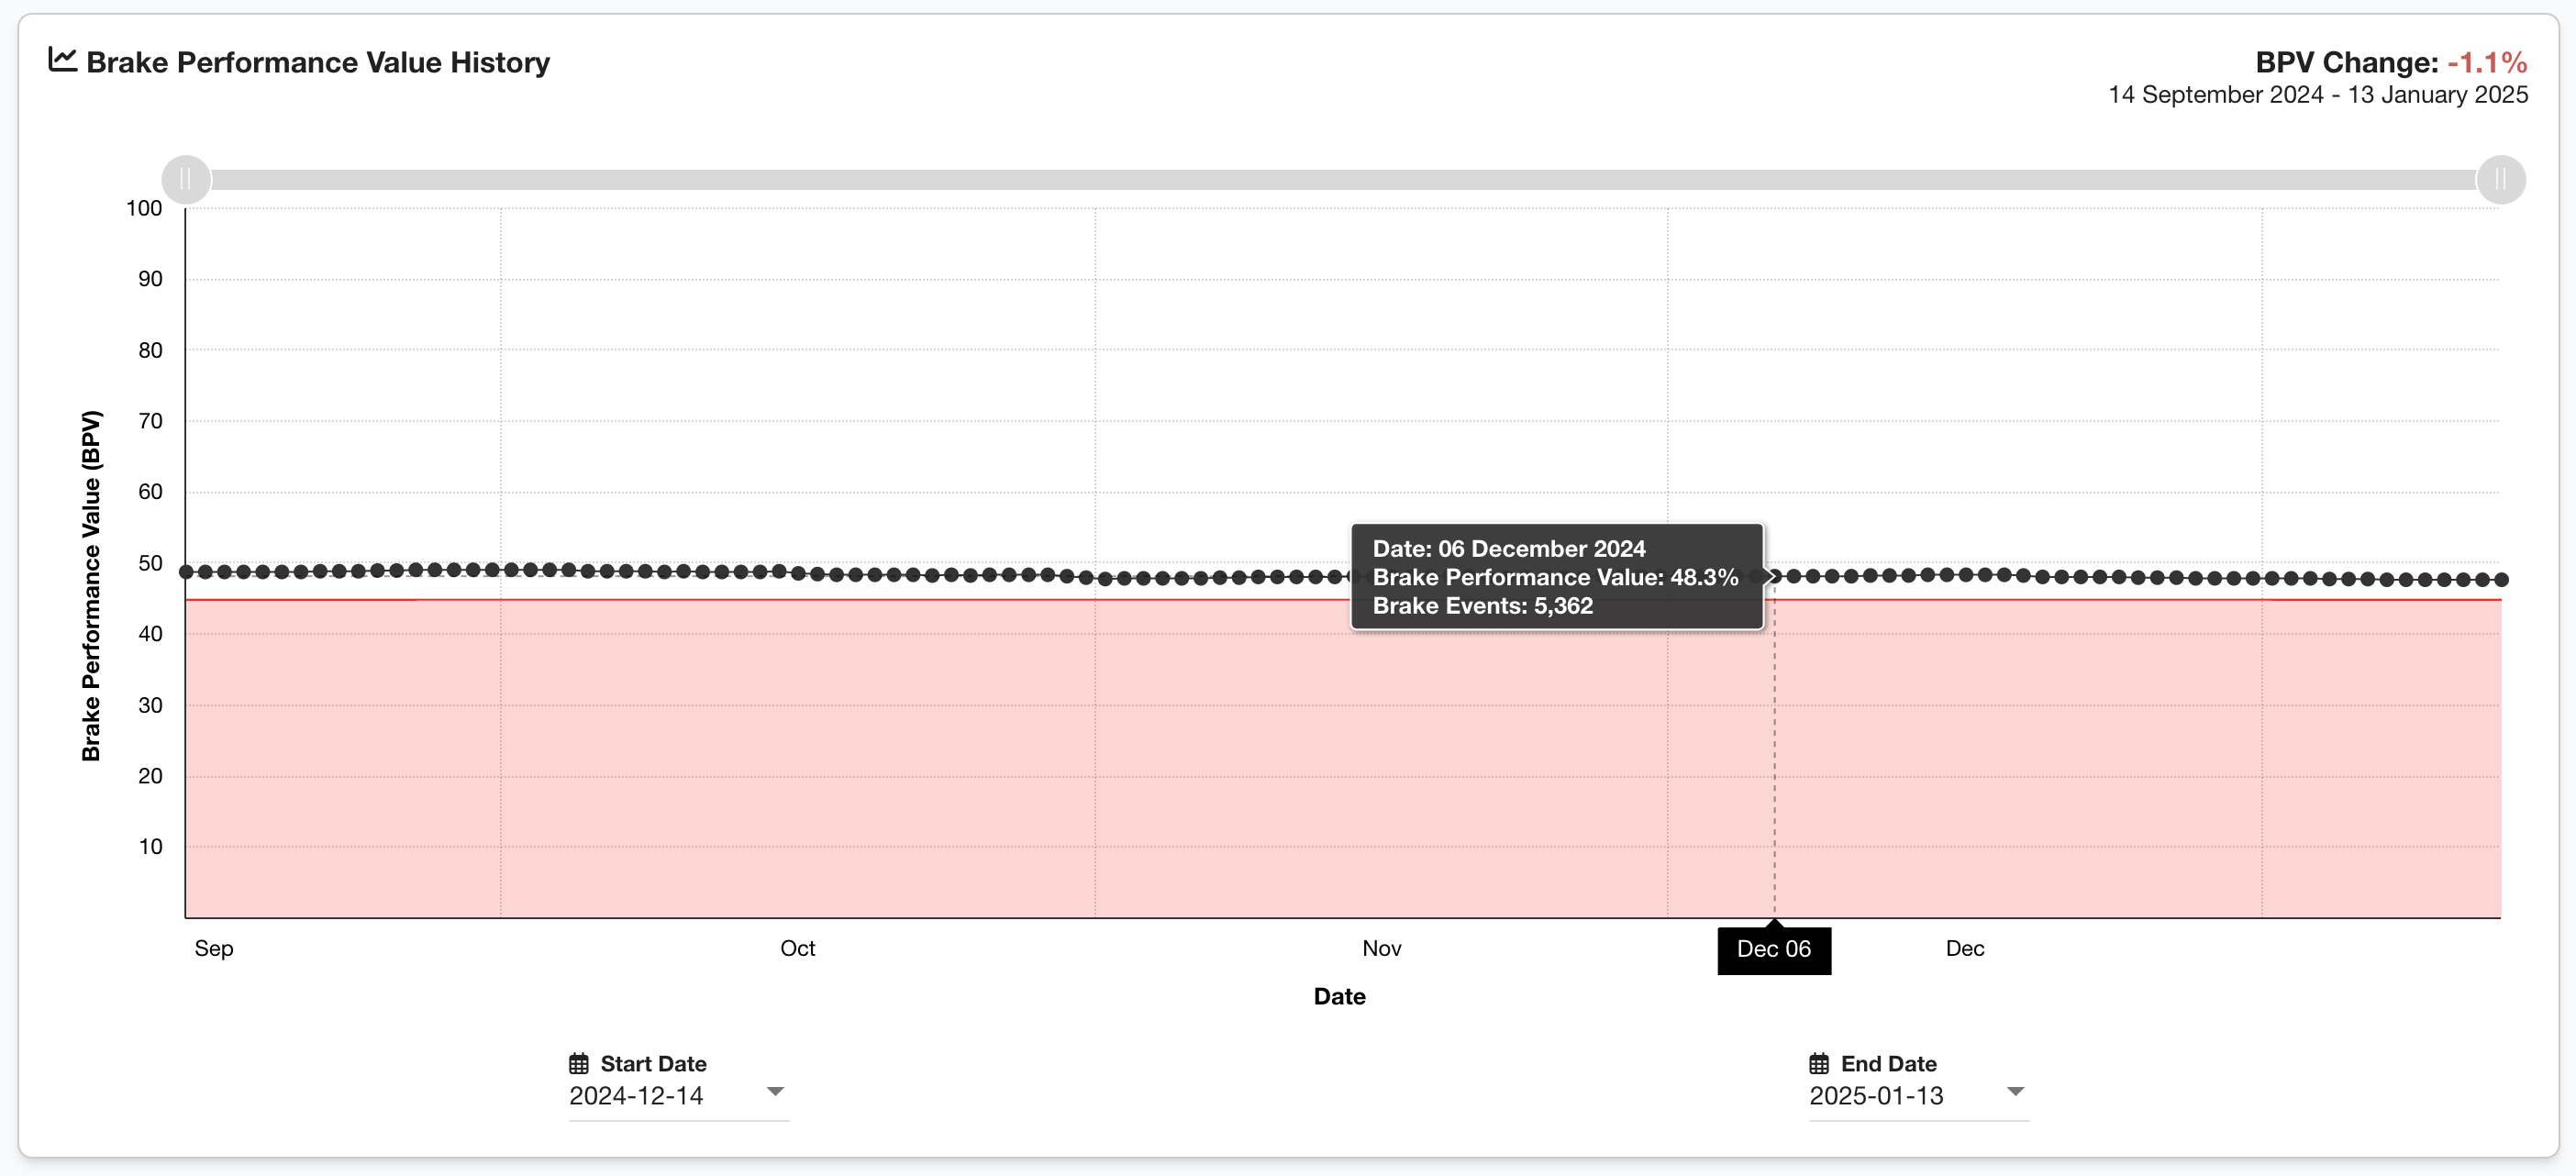
Changing Date Range
You can change the date range plotted on the EBPMS graph by using the date-pickers below the graph to change the start and/or the end date.
You’re on the Asset Dashboard.
You’re on the page EBPMS.
-
Click Start Date OR End Date.
-
A Calendar will open.
-
-
Scroll up or down to change the months of the calendar.
-
Click on the relevant date you want to apply to the graph.
The shown date range has been changed.
.gif?cb=42dde6bc27b4c9db5533e9c1d60d6d15)
Qualifying Brake Events

Below the summary and graph sections is an icon to quickly show whether there is enough qualifying data to produce a brake performance value. The icon will either have a ✅ or a ❌.
-
✅ A green tick means the asset has been driven enough and produced enough brake events to calculate an accurate Brake Performance Value.
-
❌ A red cross for ‘Qualifying Brake Events’ means the asset does not have enough data to produce an accurate Brake Performance Value.
🛠️ EBPMS Features
❓ Frequently Asked Questions
"Why is my Asset's 'Brake Performance Value Not Available'?'
If you come across a message similar to the one below on your Asset View in EBPMS:

This Asset does not have sufficient brake events to accurately calculate its brake performance value.
It is common for brake events to be discluded from the qualifying brake events if you have for a particular asset, only brake events that occurred after the reset date will qualify to be used to calculate its EBPMS score.
With use, the Asset should generate more brake events, enabling it to produce an accurate brake performance value.
"Why does my asset have a 'critical' EBPMS status, even though the Brake Performance Value is good?'
Other than a Brake Performance Value lower than the pass mark, an asset could also have a critical EBPMS status if the EBS has reported multiple consecutive bad brake events.
In most cases, this issue will resolve itself after multiple consecutive good brake events. However, we recommend getting your asset's brakes checked as this usually indicates poorly performing brakes and potential issues.
View more information about Interpreting EBPMS Data.