.png)
Dashboards are made of widgets, which are cards of information. The widgets can be added, organised and grouped to form a dashboard of useful information.
The Dashboard provides a comprehensive overview of your fleet using numerical breakdowns, graphs and tables to deliver important information efficiently.
🧭 Getting to the Dashboard
-
Click Dashboard in the navigation bar.
You’re on the Dashboard page.
📚 Dashboard Information
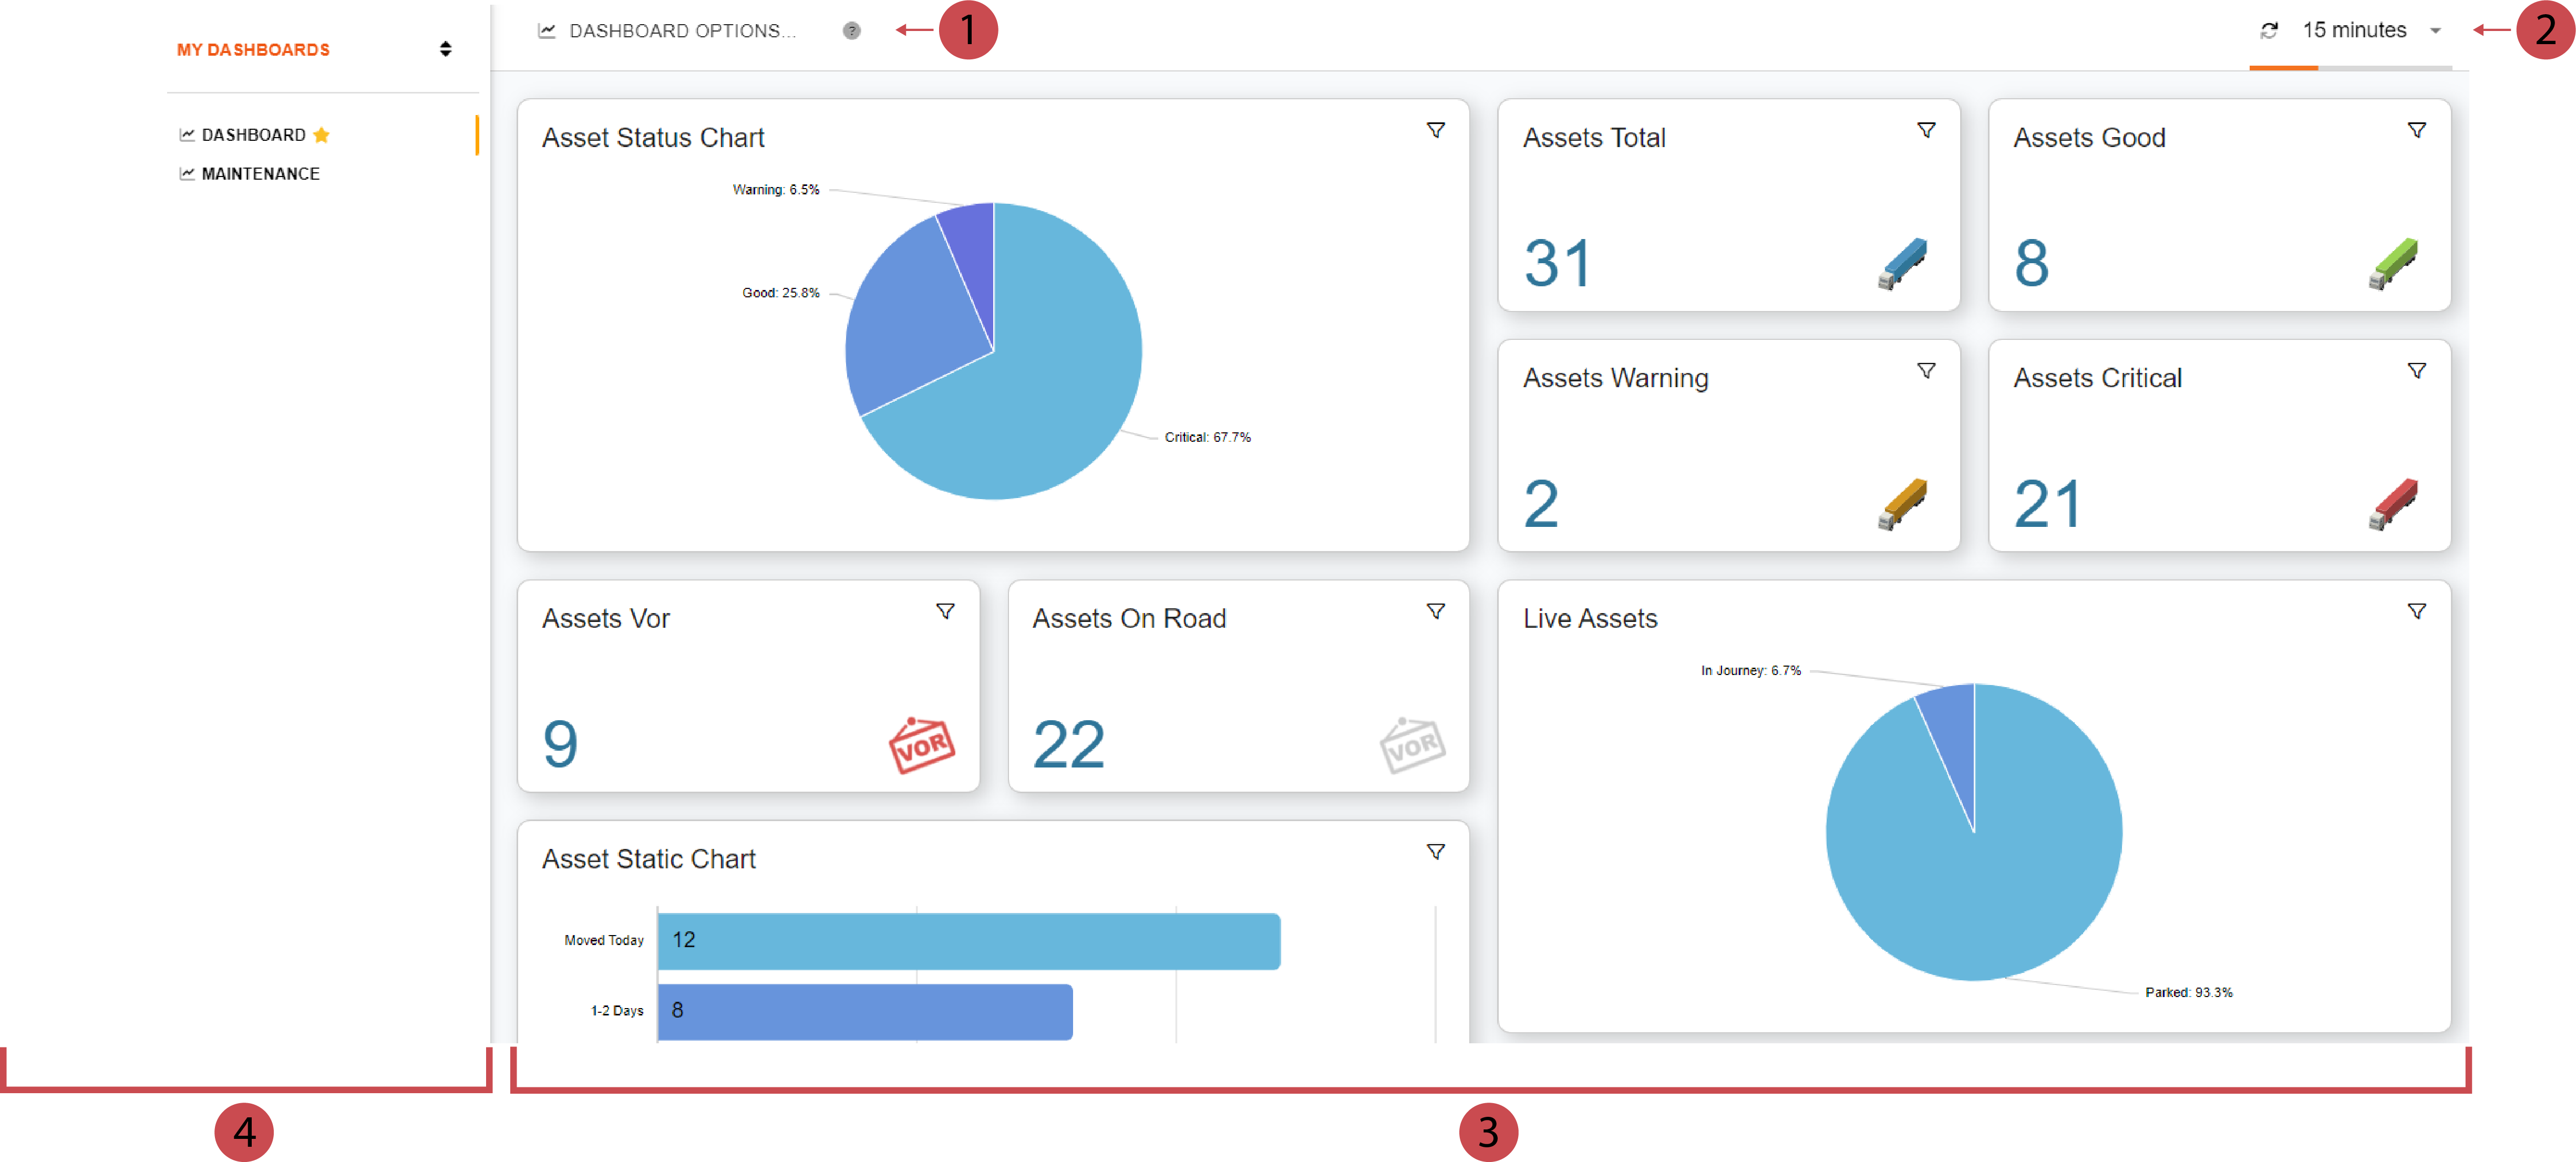
The dashboard page is made up of a left navigation sidebar and the main dashboard content area on the right. On loading the page you will see your default dashboard, or if no default is set you will see the standard dashboard.
|
No. |
Description |
|
|---|---|---|

|
Dashboard Options This is your control panel to add, edit and delete dashboards. For more information scroll down to the What does each Dashboard Option mean? section. |
|
|
.Set Refresh Interval Here you can define the interval for how often the dashboard should be updated. |
|
|
Content Area The Dashboard will be shown in the content area of the page. The dashboard is made up of widgets, which use either graphs, total values, or tables to communicate information about your fleet. |
|
|
Sidebar The sidebar is primarily for changing the dashboard displayed in the content section. The navigation bar on the left lists all the dashboards you have access to. |
|
Widgets
Widgets sum up important information and visualise them in various forms. When you click on a widget a list with all the assets that make up the widget value will open. There are three different types of widgets which are:
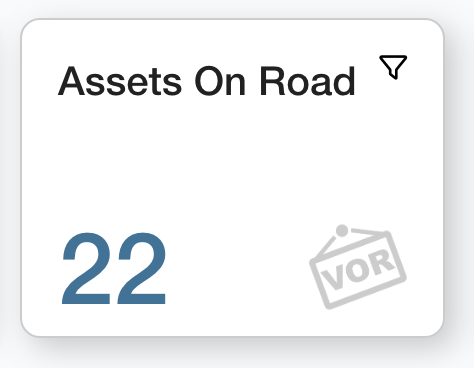
Total Values
Total Value Widgets display information in numbers
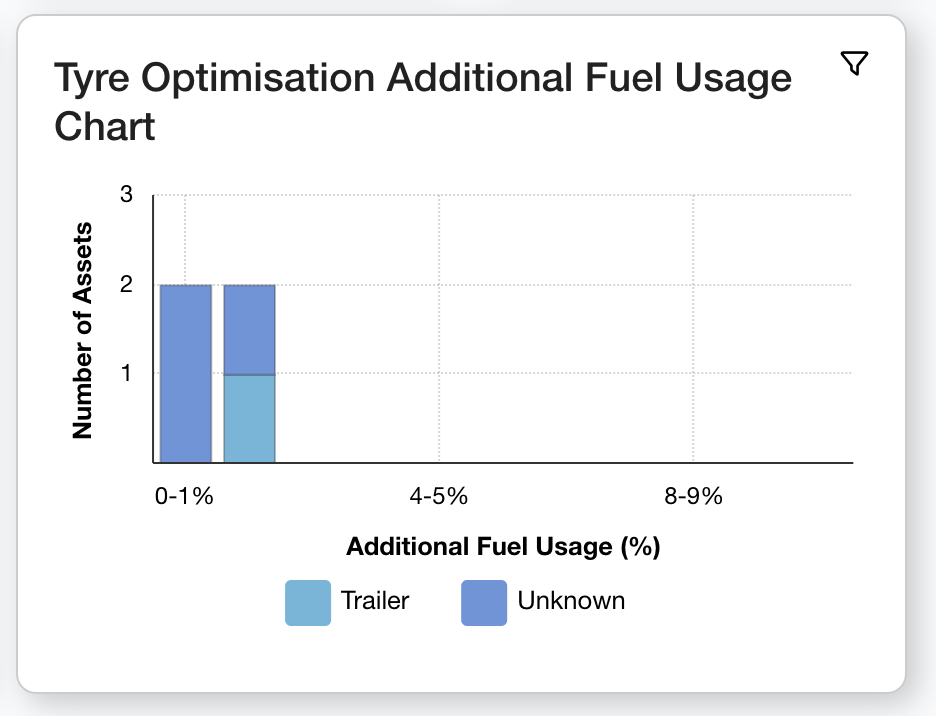
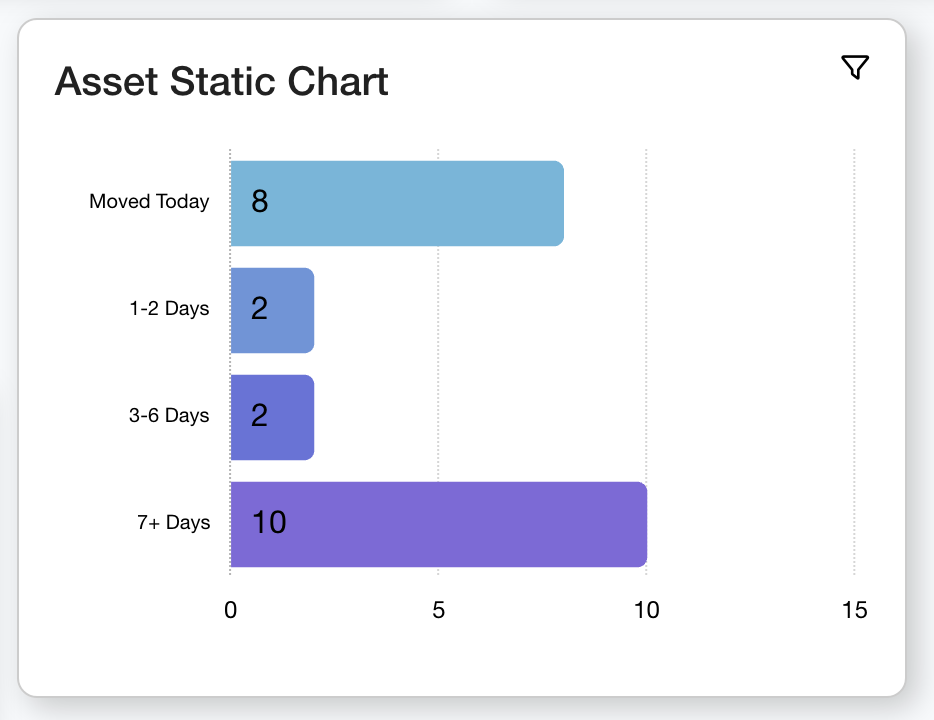
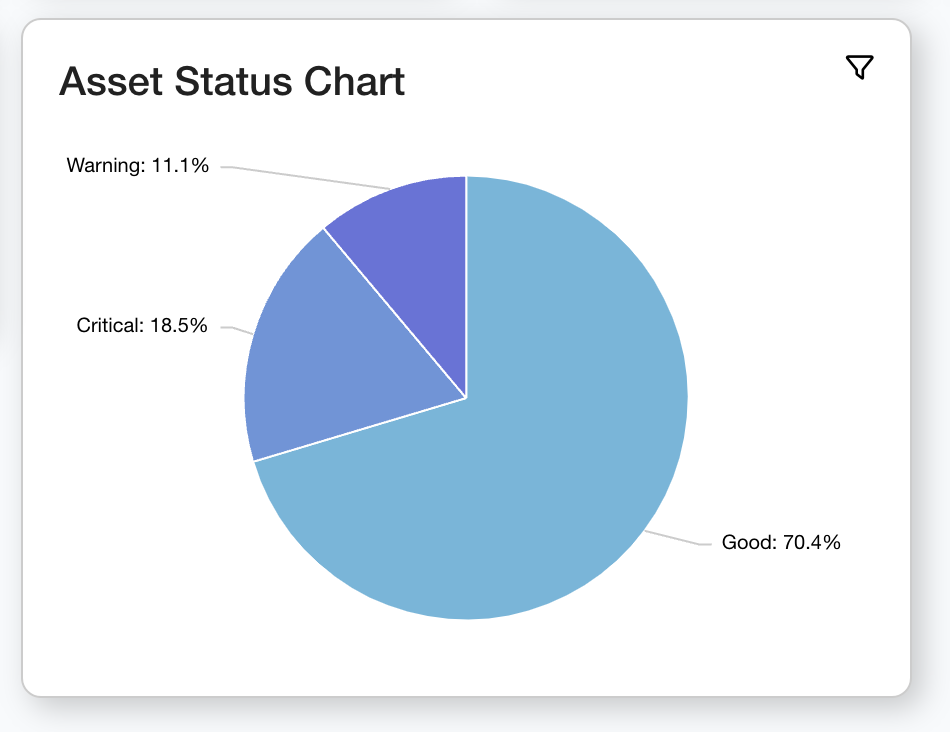
Charts and Graphs
Graph widgets are great for quick data analysis and comparison. The main graphs used for the widgets are pie charts, bar charts and stacked bar charts.On particular charts you can hover over the plotted data to see more information. You can also click into the slice or bar on a chart to view a breakdown of the assets which make up that statistic.
Tables
Table widgets are great for showing which specific assets meet certain criteria; allowing you to see exactly which assets are included in statistics. The table consists of rows - each row being a new asset. Clicking on an Asset Row will redirect you to its Asset Dashboard page.